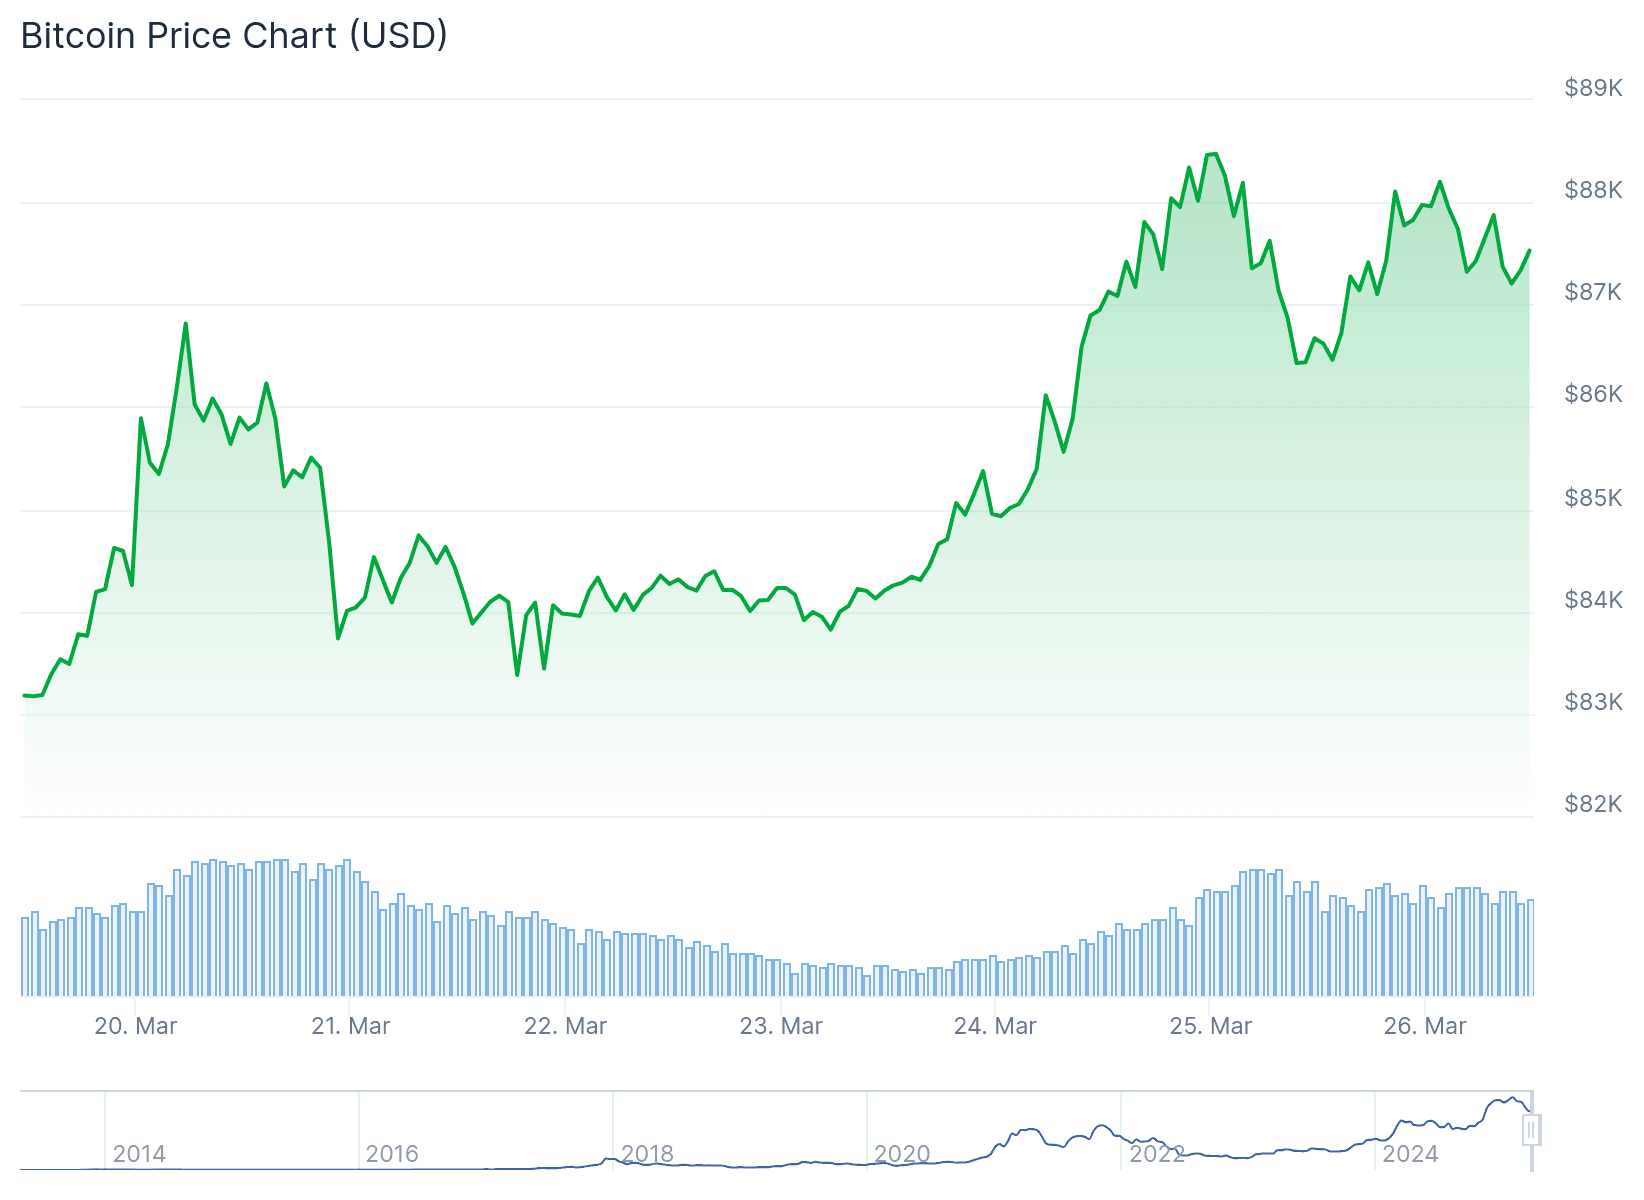
Bitcoin’s Recent Price Action: A Double Top Formation

Bitcoin (BTC) appears to have hit a wall in its recent recovery, as evidenced by the emergence of a double top bearish reversal pattern on the short-term price charts. Last week, BTC reached a peak close to $87,400, only to pull back to approximately $84,000 on Friday. Following this, a brief recovery saw prices climb back above $87,000 before stalling once again.
This sequence of two notable peaks at nearly the same price level, separated by a trough, indicates the formation of a classic double top. This bearish pattern is often interpreted as a signal that an uptrend may be coming to an end. According to technical analysis, the double top pattern typically requires confirmation through a decisive drop below the “neckline,” which serves as the support level between the two peaks and currently stands at around $86,000.
If Bitcoin were to drop below this critical support level, it could potentially decline toward $75,000 or even lower in the short term. However, long-term charts still suggest that the asset remains within an ascending range, indicating that bullish sentiment may not be completely extinguished.
Traders were encouraged by the U.S. Federal Reserve’s dovish stance on inflation and a reduction in concerns regarding upcoming U.S. tariffs, both of which have contributed to recent gains. Nevertheless, the lack of correlation between altcoins and Bitcoin’s recent price movements raises concerns that the current rally could be a “fakeout,” lacking the broad market support typically seen in a genuine uptrend.
A potential downturn in Bitcoin’s price could have a ripple effect across major cryptocurrencies, undermining recent gains and dampening hopes for a sustained rally. Dogecoin (DOGE), which is particularly influenced by market sentiment and speculative trading, could face significant losses if Bitcoin’s bearish pattern materializes. Similarly, XRP might experience waning momentum, especially given its sensitivity to market sentiment and ongoing regulatory developments.
Solana could also be particularly vulnerable, especially in light of its recent volatility and concerning technical indicators. The cryptocurrency is nearing the formation of a “death cross,” a bearish signal where the 50-day moving average crosses below the 200-day moving average, a pattern that historically precedes deeper losses.
At this juncture, Bitcoin finds itself in a critical zone. A weekly close below $84,000 could solidify the bearish double top scenario, while a surge above $87,500 might negate this pattern, potentially reigniting bullish momentum.


