
Bitcoin is down 10% after breaking the key $28,500 support zone. It could also drop below the $25,000 support zone, according to technical analysis by NewsBTC’s Aayush Jindal.
Bitcoin Gains Bearish Momentum
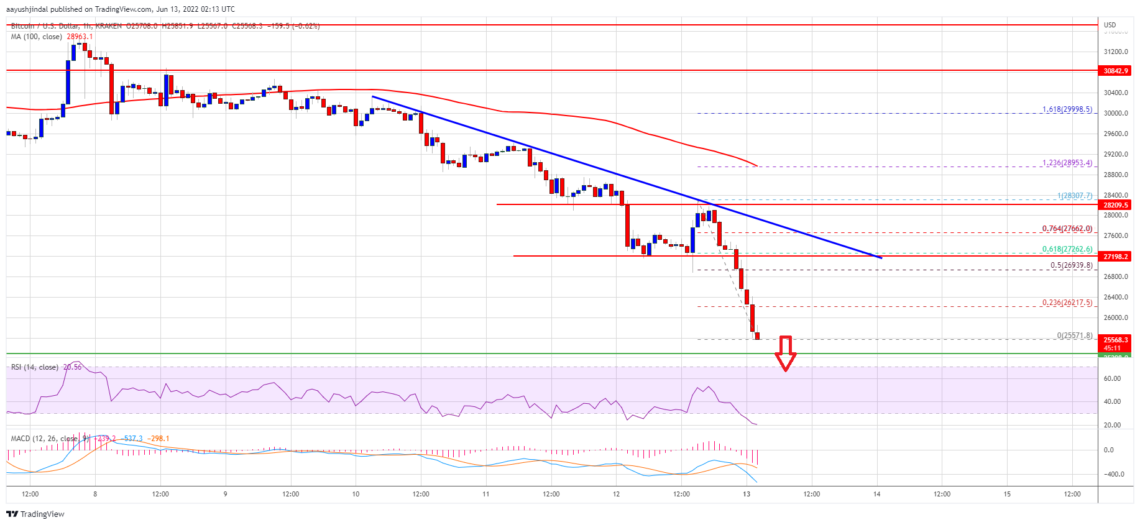
Bitcoin broke the $29,500 and $28,500 support levels after failing to break through the $30,000 resistance zone. There was a major decline below the $28,000 level. BTC is down about 10% and even broke the $26,500 support level. A multi-week low is forming near $25.571 and BTC is signaling more declines.
Bitcoin is currently trying to hold the $25,000 level. There is also a key bearish trend line forming with resistance near $27,200 on the hourly chart of the BTC/USD pair. An immediate resistance on the upside is near the $26,200 level. This is near the 23.6% Fib retracement level of the recent decline from the $28,307 low to $25.571 high. The first major resistance is near $27,200 and the downtrend line. The 50% Fib retracement level of the decline from the $28,307 low to $25.571 high is also near the trendline resistance. The main resistance is near the $28,500 level. A clear move above the $28,500 resistance level could push the price higher.
Will Bitcoin Drop More?
Jindal says that if Bitcoin fails to break past the $27,200 resistance zone, it may continue to move lower. The next major support is near the $25,000 level. A break below the $25,000 support could bring the price down further. In the stated case, the price could decline to the $23,500 support zone in the near term.
What Do Technical Indicators Say?
- Hourly MACD – The MACD is now gaining momentum in the bearish zone.
- Hourly RSI (Relative Strength Index) – The RSI for BTC/USD is currently in the oversold territory.
- Major Support Levels – $25,500 followed by $25,000
- Major Resistance Levels – $26,200, 27,200 and $28,500