
Bitcoin started a sharp decline below the $25,000 support yesterday. BTC is down 20% and it is approaching the key $20,000 support zone. According to technical analysis by NewsBTC’s Aayush Jindal:
Bitcoin Drops Hard
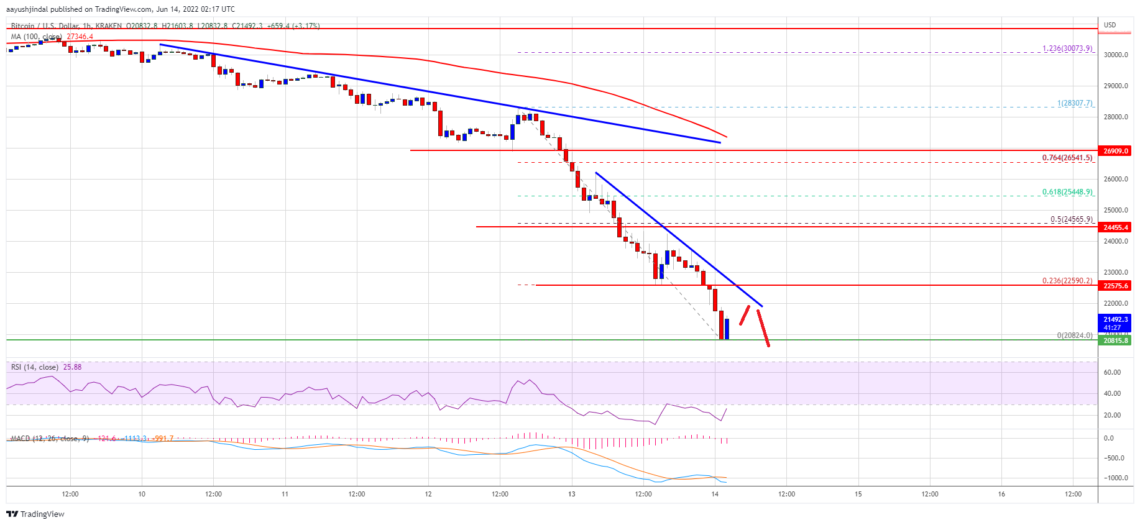
Bitcoin failed to start a recovery wave and dropped below the $25,000 support zone. extended. The bears gained strength for a move below the $23,500 support zone. The price is down over 20% and even traded below the $22,000 support zone. A bottom was formed near $20.824 and the price is still trading in a strong downtrend. There was a close below the $22,000 level and the 100 hourly simple moving average. There is also a connecting bearish trend line forming with resistance near $22,100 on the hourly chart of the
BTC/USD pair. This is near the 23.6% Fib retracement level of the low from the $28,300 high to $20.824 low.
If there is a clear move above the trendline, the pair could rally to the $23,000 level. The main resistance is near the $25,000 level. This is close to the 50% Fib retracement level of the drop from the $28,300 high to $20.824 low.
Will Bitcoin Drop More?
Jindal says that if Bitcoin fails to break past the $22,100 resistance area and trendline, it may continue to move down. An immediate support is near the $21,000 level. The next major support is near the $20,000 level. A downside break below the $20,000 support could push the price down further. In the stated case, the price could decline to the $18,500 support zone in the near term.
What Do Technical Indicators Say?
- Hourly MACD – The MACD is now gaining momentum in the bearish zone.
- Hourly RSI (Relative Strength Index) – The RSI for BTC/USD is currently in the oversold territory.
- Major Support Levels – $21,000 then $20,000
- Major Resistance Levels – $22,000, 22,100 and $23,000