
Bitcoin failed to recover above $23,000 and started a fresh decline. According to technical analysis by NewsBTC’s Aayush Jindal, there is a risk of a drop below the $20,000 support.
Bitcoin Revisits $20,000
Bitcoin attempted a fresh increase above $22,000, but bears were active near $22,800 and $23,000. . A high was formed near $22,950 and the price started a fresh decline. There was a clear move below the $21,500 level
and the price settled below the 100 hourly simple moving average. It even settled below the $21,000 level and traded close to the $20,000 support area. A bottom was formed near $20,200 and the price is now attempting an upside correction. There was a move above the $20,500 resistance level. Bitcoin is currently testing the 23.6% Fib retracement level of the drop from the $22,950 high to $20,200 low. There is also a key bearish trend line forming with resistance near $20,850 on the hourly chart of the
BTC/USD pair. According to him, an immediate resistance is near the $21,000 level. The first major resistance is near the $21,550 level. The 50% Fib retracement level of the recent decline from the $22,950 high to $20,200 low is also near $21,550. Any further gains could lead the price towards the $22,300 level or the 100 hourly simple moving average. The main resistance is still near the $23,000 level.
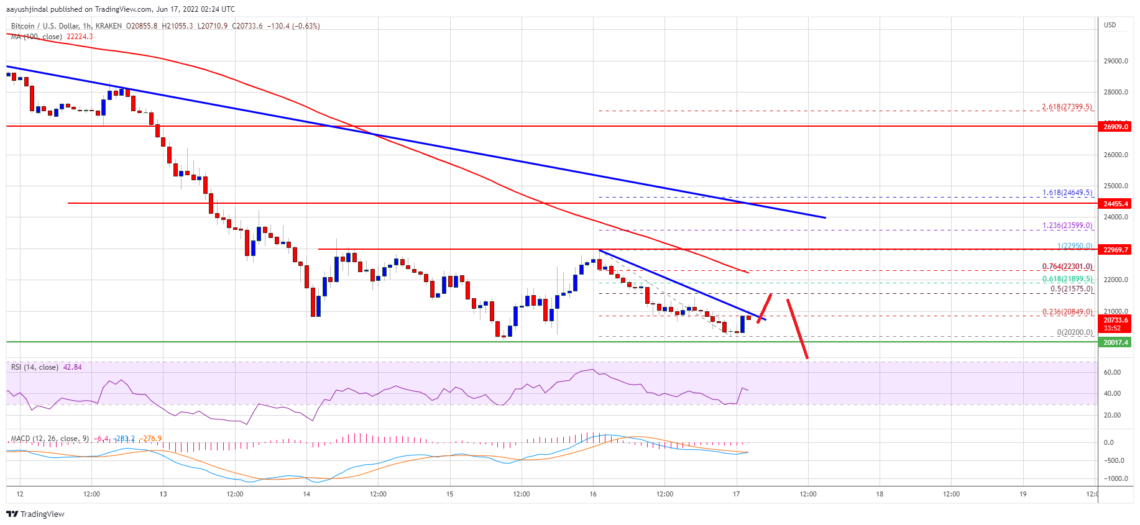
Will Bitcoin Drop Again?
Jindal says that if Bitcoin fails to break past the $22,000 resistance zone and trendline, it could start a fresh decline. An immediate support is near the $20,200 level. The next major support is near the $20,000 level. A downside break below the $20,000 support could trigger a sharp decline. In the stated case, the price could test $18,800.
What Do Technical Indicators Say?
- Hourly MACD – The MACD is now losing momentum in the bearish zone.
- Hourly RSI (Relative Strength Index) – The RSI for BTC/USD is currently below the 50 level.
- Major Support Levels – 20,200 then $20,000
- Major Resistance Levels – 21,550, 22,300 and 23,000