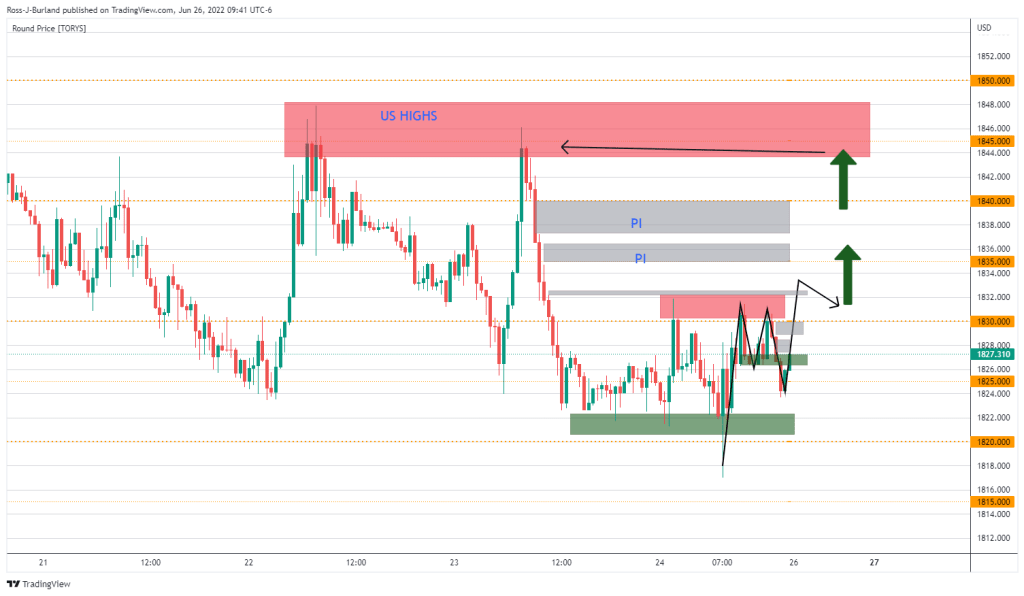
Gold prices are oscillating back and forth above $1,820. Gold is poised to offer something for both bulls and bears, according to market analyst Ross J Burland. Meanwhile, will gold’s rival US dollar continue to fall, causing a gold short squeeze? We have prepared Ross J Burland’s analysis for our readers.
Weekly gold analysis
cryptocoin.com As you can follow from , the gold price is stuck in a range. Investors closed short positions close to $1,800. Also, traders forced the price back to $1,880 in three pushes before a retest of $1,800 again. Therefore, the gold price remained in a horizontal range in both daily and hourly perspectives. Gold opens the new week after closing at $1,827 with no clear bias one way or another:
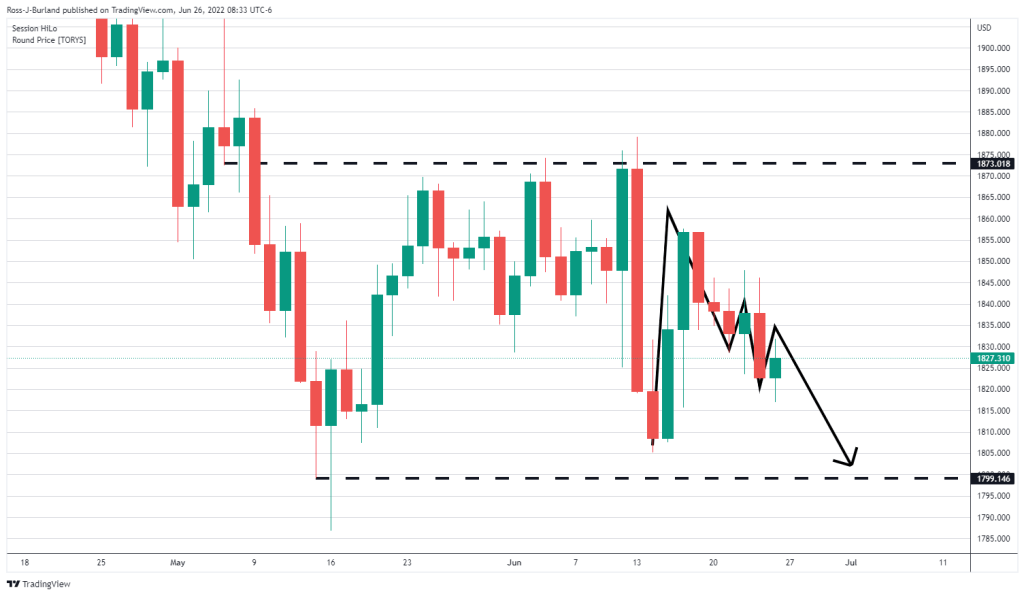
Gold price is in the middle of the range where the neckline of an M-formation meets potential resistance. This, in turn, is likely to lead to a downward continuation of the broadening sell-off. It seems that all three previous sessions on Friday were consolidation days. Therefore, the week entered a period that could be the beginning of a breakout.
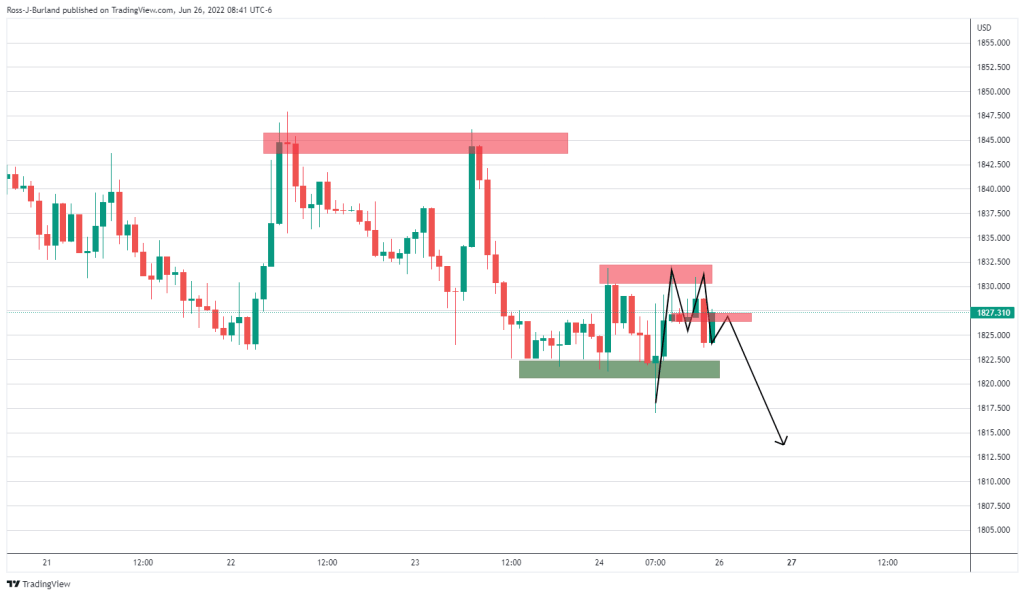
On the hourly chart, we can see that the price is consolidating the double top selling at $1,850. Besides, the M-formation is likely to be a potential move at $1,820. In addition, we are likely to see the downside break and it being compelling to widen the range.
M15 chart analysis of gold
On the other hand, we see a gap in the bids on the 15-minute chart towards the highs of this hourly range as below.
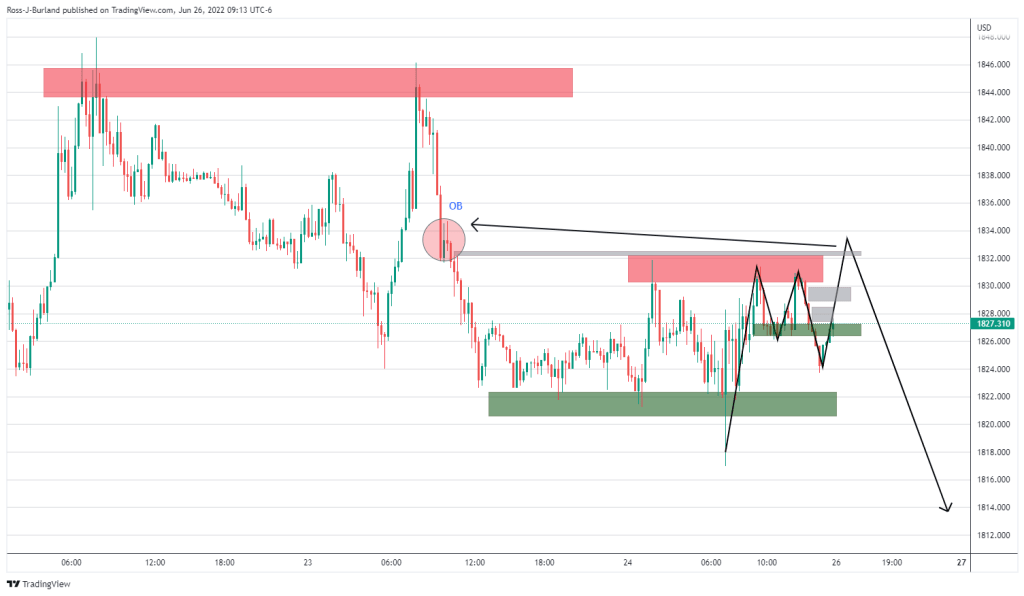
According to the thesis, as the week intensifies, it is possible for the market to move higher to gather liquidity for a final move to the order block before the eventual decline to the downside.
DXY view
All that said, and considering the US dollar, there should be a bullish thesis applied in the case of a weaker dollar.
Last week, the following US Dollar Price Analysis is important. From a test below, the bears pull out the vulnerable short-term structure at 103. Next, he argues the case for lower DXY.
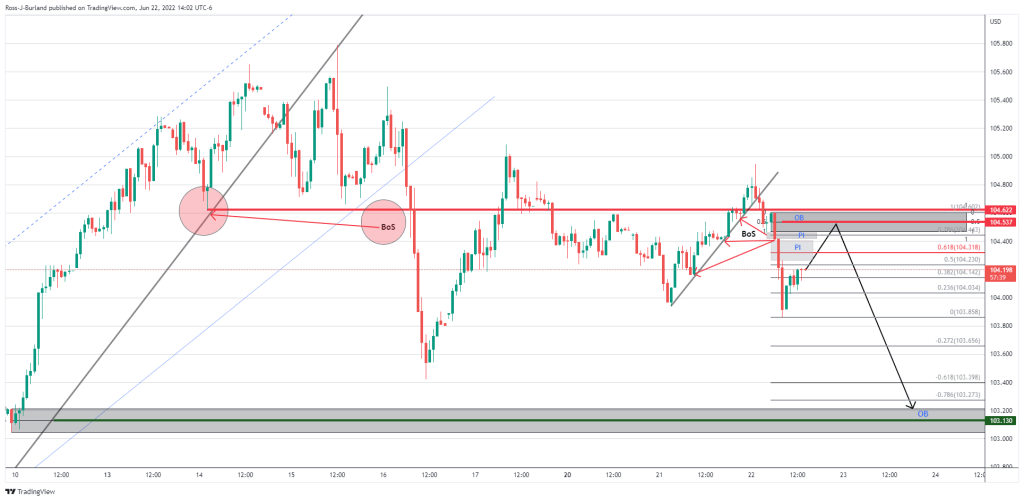
Also, we saw that the price action happened as follows.
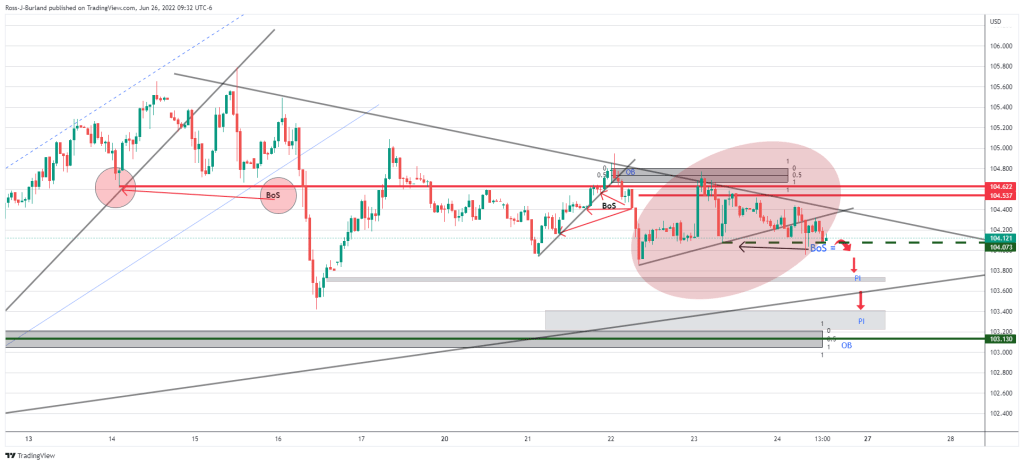
If there is more, DXY is likely to break the structure and head towards price imbalances and the order block around 103.10. What does this mean for gold?
bull case for gold
There is a bullish condition for the yellow metal. This comes above the current consolidation rage above $1,832 towards previous highs in the previous two US sessions, followed by $1,850 as follows:
