Gold lost all of its initial gains and fell to $1,820. According to Commerzbank strategists, ETF outflows play a role in the weak performance of precious metals. In this environment, market analyst Dhwani Mehta is making a roadmap for gold.
“The gold/silver ratio is very high around 86”
Another big outflow from ETFs has likely put pressure on gold, according to Commerzbank strategists. Assets in gold ETFs tracked by Bloomberg were down by as much as 6 tons yesterday. Hence, the momentum of the exits has picked up again recently. Strategists make the following assessment:
Silver ETFs tracked by Bloomberg have seen significant ups and downs in recent weeks and months. Silver’s weakness is also evident in the gold/silver ratio, which is very high around 86.
“It is possible that these data may affect the yellow metal”
However, there is an interesting optimism in the markets. The upbeat global momentum of the previous week is back. This is limiting the broad US dollar recovery. According to Dhwani Mehta, Tuesday marks a reversal for financial markets. However cryptocoin.comAs you follow, investors remain cautious ahead of this week’s key NATO Summit and a policy panel made up of Fed, BOE and ECB heads.
Gold continues its gradual recovery mode amid US Treasuries, continued recession fears and an aggressive Fed rate hike course. However, there is no upward movement in the yellow metal. Buyers also remain cautious. Because a number of important US economic data will be released this week. These data are likely to prompt markets to reprice hawkish Fed expectations. According to the analyst, it is possible that this will also affect gold prices.
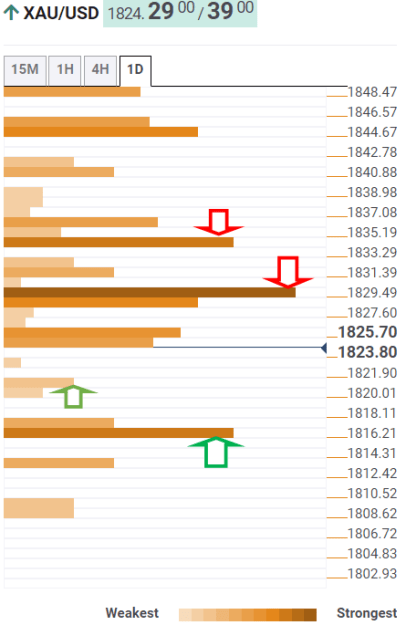
Important levels to watch for gold price
Dhwani Mehta uses the Technical Confluence Detector for the technical view of gold. He analyzes the results as follows. It shows the price of gold approaching strong support near $1,820, where the previous day’s low and the lower band of the four-hour Bollinger Band converge.
The selling rate is likely to accelerate below the latter. Also, a 23.6% monthly Fibonacci retracement from the previous week’s low and daily S1 pivot point convergence at $1,816 is possible.

Meanwhile, the line in the sand for gold bulls rests at $1,813 at the weekly pivot point S1. However, the bulls need to find a strong foothold above the $1,829 barrier, which is a combination of the 5-day SMA and the daily and weekly Fibonacci 38.2% retracement level.
The next stop for the bulls is aligned at the 10-day SMA at $1,832. Above this, the daily Fibonacci 61.8% level at $1,835 will come to the rescue of sellers. Further higher, the intersection of the weekly Fibonacci 61.8% level and the daily R1 pivot point at $1,837 will offer stiff resistance.