Bitcoin (BTC) bear markets come in many shapes and sizes. But what they all have in common is panic. BTC has been described as facing “a bear of historic proportions” in 2022. Regardless of price, however, the 2022 on-chain data looks different. For you, we take a close look at four key metrics that show that the Bitcoin bear market is not like the last one.

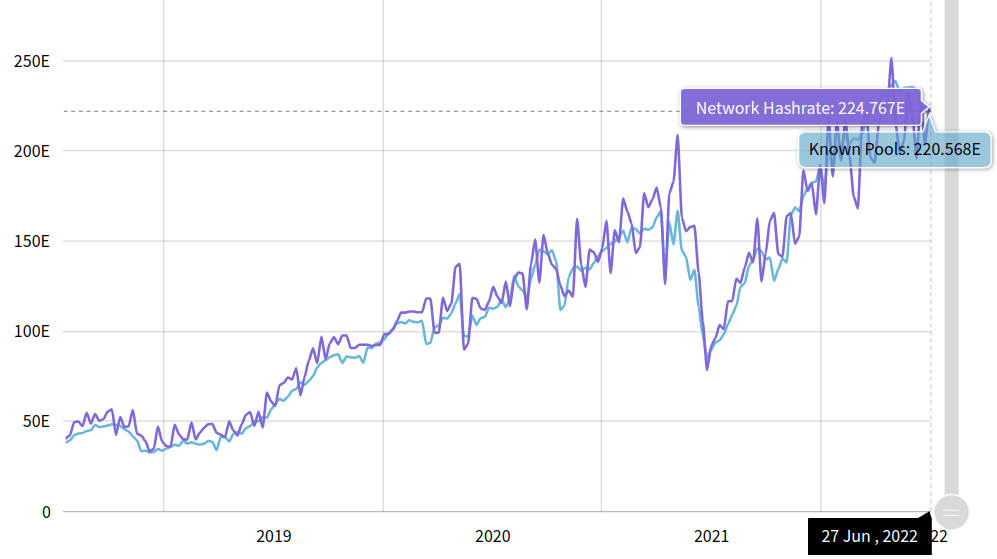
Bitcoin Hash rate
Long-time market investors will remember the exit of Bitcoin miners from China after the bans, in one of mining’s most productive spins. The extent of the ban has been cast in doubt ever since. In addition, many miners moved from the country within a few weeks after the bans. As a result, at that time, Bitcoin’s hash rate roughly halved. Uncertainty prevailed at the time, as the miners felt that they had no choice but to at least temporarily halt operations.
At current rates, it is not bureaucracy that threatens miners. We can summarize the situation with just simple math. The BTC price slumped to 19-month lows, putting increasing pressure on the earnings of mining operations. However, as we reported on cryptokoin.com, there are thoughts that the miners who are supposed to sell the BTCs have already done so. However, it should be noted that even at current levels, a mass sale event may not occur. Data from data source MiningPoolStats supports this thesis, with the hash rate dropping by a maximum of around 20% from all-time highs before recovering.
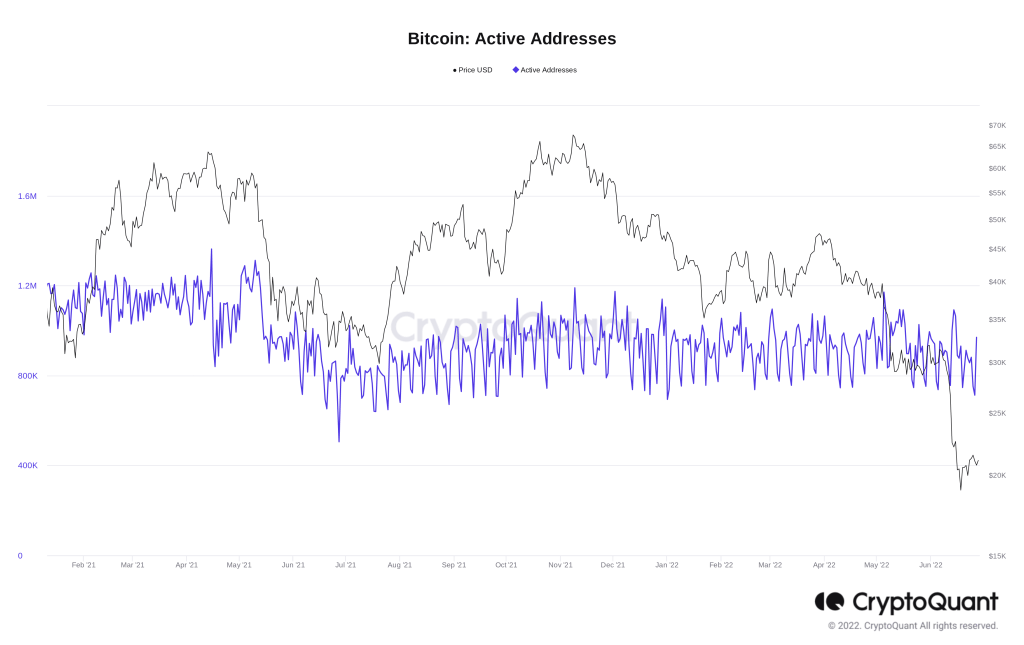
Active address numbers
Adding to the July 2021 drop was a slowdown in Bitcoin network activity. Active addresses, as measured by the on-chain analytics platform CryptoQuant, fell noticeably through June last year before recovering in line with the price in the third quarter.
This time, however, such a decline did not occur. This indicates that the market is more busy moving their BTC. This has some consequences. Owners may have become sellers due to low prices. Also, traders may be trying to profit from volatility. However, overall in-chain volume remains low. It is also worth noting that the buy-side support means that the downside price trend is likely insufficient to end the downtrend, analysts said.
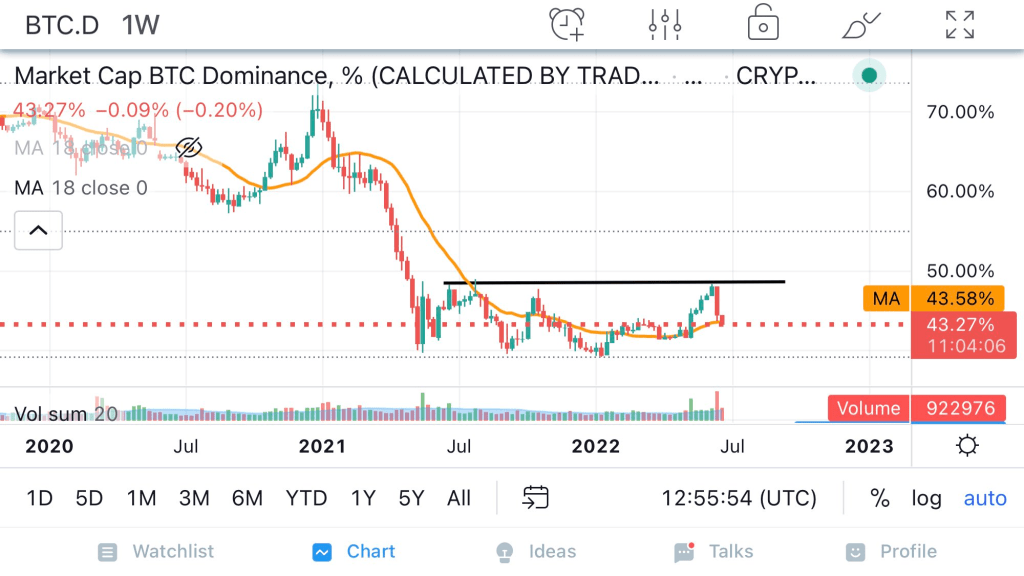
Bitcoin Dominance
The BTC Dominance indicator, which tracks how much of the total cryptocurrency market capitalization belongs to Bitcoin, has not hit 50% since July 2021, when it bottomed around $30,000 before rising to an all-time high of $69,000. A rising BTC Dominance indicates that Bitcoin is rising faster than other crypto assets. It is also interpreted as altcoins losing value.
Traders see a rising BTC Dominance chart as a sign that Bitcoin is rising into the safe zone. On the other hand, a falling BTC Dominance chart shows altcoins gaining value faster than Bitcoin. Traders generally dislike a bearish BTC Dominance chart. They also describe it as a signal of excessive speculation in crypto markets.
Current foreign exchange reserves
Despite the generally lower volumes mentioned above, Bitcoin is currently trading at around $20,000 on exchanges. Normally, price drops trigger entries into stock markets as panicked traders prepare to sell or short. But this time, it seems, it’s really a different situation in this respect.
The 21 major exchanges tracked by CryptoQuant had 2,544 million BTC at the start of Q2. However, according to the recently announced data, it finally has 2,419 million BTC. Last year, foreign exchange reserves had risen during the second-quarter downtrend. However, recently the decline has started again.