According to crypto analyst Yashu Gola, it is possible to grow 100% in the second half of 2022 as the market valuation of Uniswap (UNI) shows a classic bear trend. However, for the altcoin project to trigger this scenario, it must break above an important technical resistance level. Otherwise, the analyst says, a bear flag awaits a 45% price collapse. We have prepared Yashu Gola’s UNI analysis for our readers.
Bull setup in altcoin price
Crypto traders are familiar with the technical setup called ‘Reverse head and shoulders’ (IH&S). In this pattern, it is formed when the price forms three consecutive troughs below a common support level (neckline) and the middle (head) is deeper than the other two (shoulders). Additionally, it is resolved after the price breaks above the support level.
The altcoin price trend since May 23 has been checking all the boxes. Because he wants to create an IH&S model out of the right shoulder. A retest of the neckline around $5.71 will form the right shoulder. Then it will increase the probability of an IH&S breakout scenario as shown below.
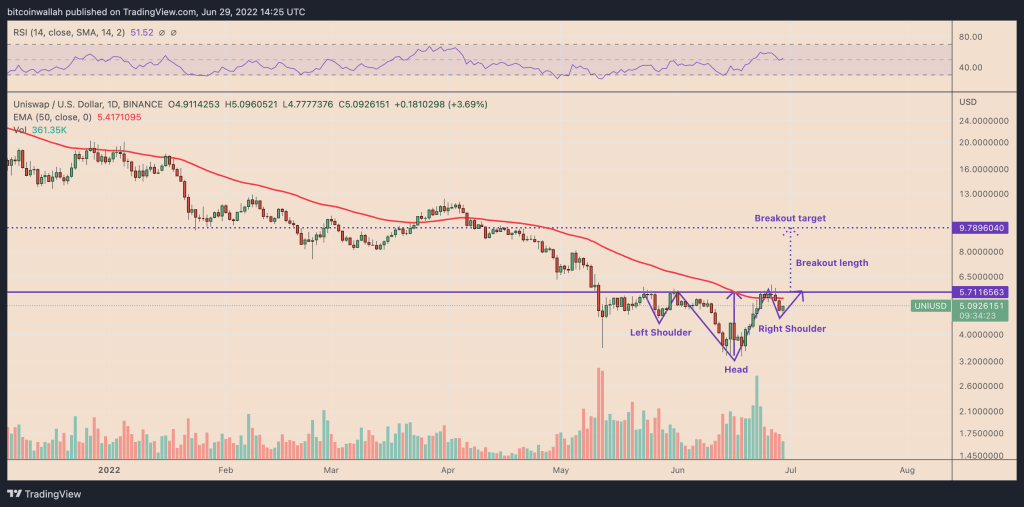 UNI daily price chart with IH&S setup / Source: TradingView
As a rule of thumb of technical analysis, it is possible for the price to rise out of an IH&S structure by the maximum distance between the lowest point of its head and the neckline. Therefore, the upside target of UNI’s IH&S stands at around $9.78, an increase of over 100% from the June 2 price.
Conflicting Uniswap price signals
Uniswap’s longer time charts highlight levels of resistance that could prevent UNI from touching IH&S targets. This includes a temporary resistance level of around $6, which has denied UNI lowering its price at least three times since May. A successful break above the $6 level is likely to cause UNI to face support at around $7.52 in February 2022. That put the test up to $12.48 before a 75% price rally.
The $7.52 level also coincides with UNI’s 20-week exponential moving average (20-week EMA; green wave in chart below). It’s currently around $7.90.
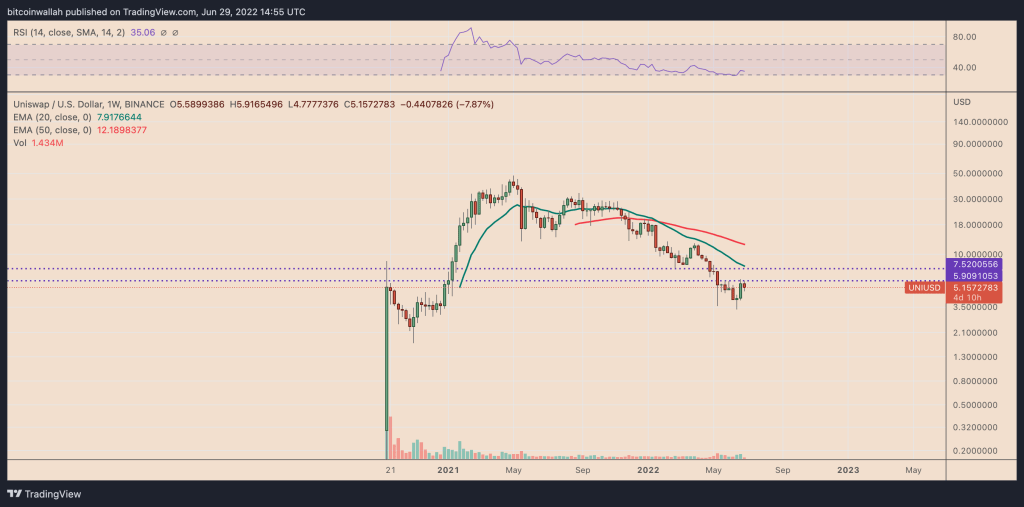
UNI 1-week candlestick chart / Source: Tradingview
Conversely, a definitive pullback from the $6 resistance level is also possible. In this case, a fall technical setup called the ‘bear flag’ arises. Accordingly, the altcoin is testing levels around $6, which coincides with the flag’s upper trendline. It then goes back to a lower level already. This leaves UNI with two potential scenarios. A decline towards the flag’s lower trendline near $3.92. Or recovery for a potential break above the upper trendline.
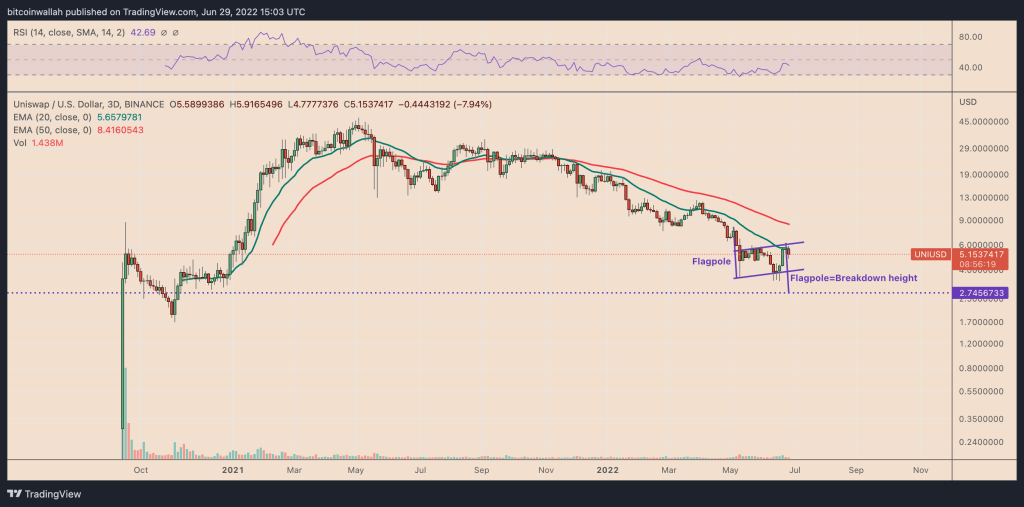 UNI three-day price chart with ‘bear flag’ setup / Source: TradingView
UNI’s move towards $3.92 risks triggering a bear flag collapse scenario. This represents a drop of over 45% to $2.75 as measured from the June 2 price. On the other hand, a break above the upper trendline will completely invalidate the flag setup. . cryptocoin.comAs you can follow, UNI rose today despite the decline in the market.