
Ethereum price was rejected from a key resistance level. This development leads to a trend reversal for the leading altcoin and a return to a stable support level. Meanwhile, shorts are rushing to take positions in Ethereum. Analyst Akash Girimath, this environment has identified levels that investors should be wary of.
Shorters target Ethereum after Merge testnet launch
Merge launched during a news sale on June 8. Thus, it caused the Ethereum price to drop 52% over the next ten days. Since then, developers have been working hard to release Merge. cryptocoin.com As we have reported, as of June 30, it has been implemented on Merge, Ropsten and Sepolia testnets. Péter Szilágyi, team leader at Ethereum, announced the release of Geth v1.19.20 earlier today.
Ok, apart from the fact that the below tweet is 9 years from the future (Geth 1.19.x), the rest still applies today. Version should have been v1.10.20. Ty @_patrickogrady for the heads up. https://t.co/YhBAbRDsy8
— Péter Szilágyi (karalabe.eth) (@peter_szilagyi) June 30, 2022
Most such major upgrades have been a news sale type event in the crypto ecosystem. For example, the launch of CME Bitcoin futures on December 18 marked the end of the 2015-2017 Bitcoin bull cycle. The launch of the Bakkt exchange on November 25, 2019 triggered a massive crash in Bitcoin price as well.
The latest example for Ethereum is the launch of the London hard fork and the most popular EIP-1559 upgrade, which has increased the price of ETH by 25%. However, it later lost 33% of its value. Although ETH Merge has been delayed numerous times, current market conditions suggest that it will not help the Ethereum price situation.
Leading altcoin enters triple-digit territory again
Ethereum price rose 45% between June 18 and June 26, reaching a high of $1,280 from a low of $880 to a high of $1,280. While this recovery was impressive, ETH later faced the 200-week SMA at $1,200 for four consecutive days. However, it failed to sustain any movement above this level.
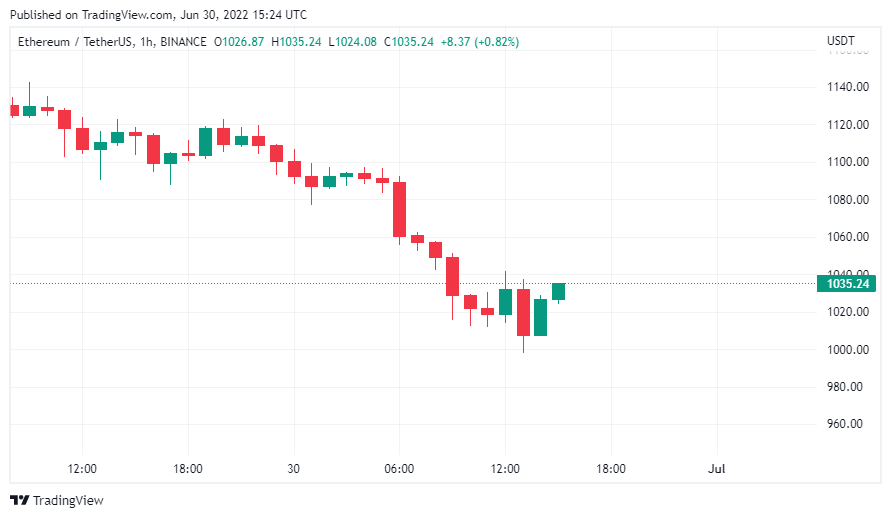
On the fourth day, Ethereum price fell below this important level. Thus, it showed that buyers were weak. Since then, ETH has lost 12%. It is currently trying to hold above $1,000.
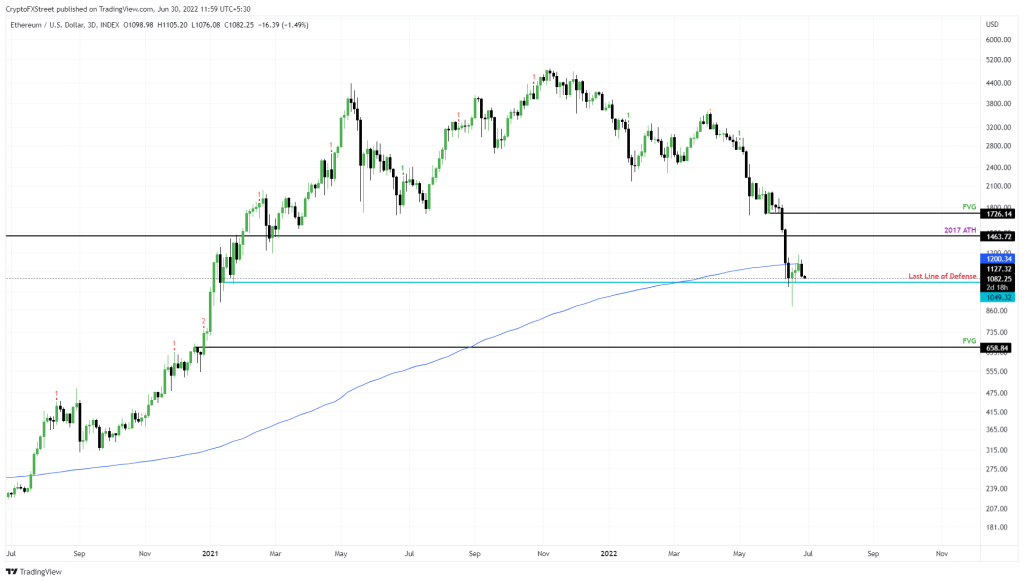
This resistance was a significant stepping stone in early 2021 quadrupling Ethereum in a short time. Despite breaking this level during the last June 19 crash, buyers are forcing ETH to produce a three-day candle close above it.
Therefore, the breaking of this resistance is interpreted as preparation for a large runny nose. Supporting this bearish outlook for altcoin price is the Fair Value Gap (FVG) stretching to $658. This price inefficiency between $658 and $1,049 was created as ETH price moved rapidly in one direction. This leaves a gap in price and trading volume. As a result, if the $1,049 support level is broken, analysts expect a 35% collapse.
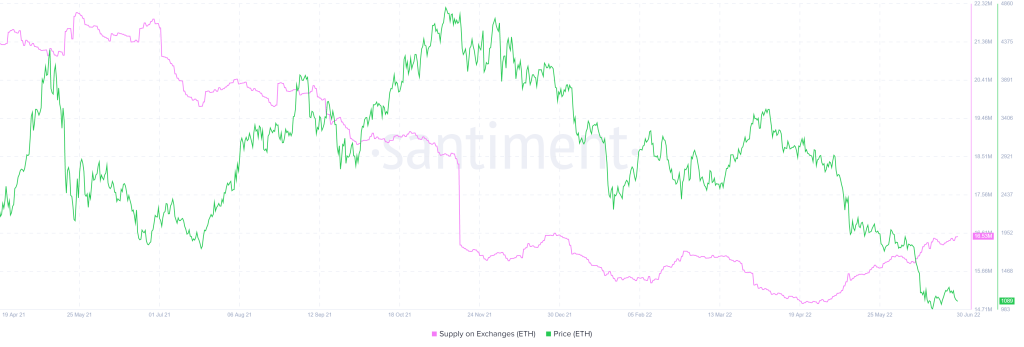
ETH held on exchanges is on a massive uptrend from 14.86 million to 16.54 million since April 2022. This 11% increase in ETH held on centralized exchanges acts as a sell-side pressure.
These investors panic sell their shares during a crash, triggering further downward pressure. As such, altcoin traders should be cautious when using leverage or trying to buy from the bottom.
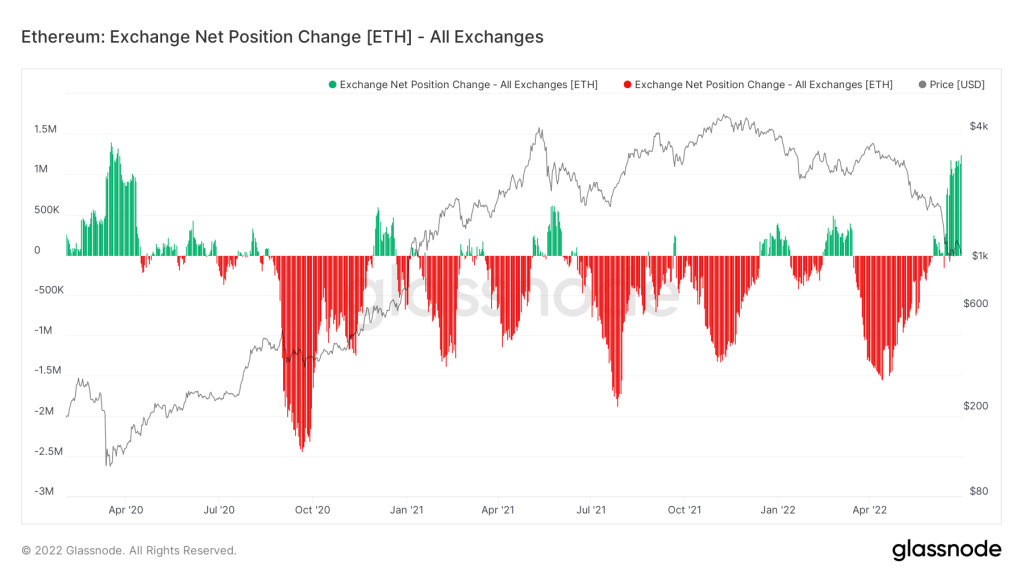
Additional evidence of the negative state of Ethereum price is the exchange net position change index, which shows that 1.24 million ETH has been sent to exchanges. This entry is interpreted in two ways. The first is that market participants use their assets as collateral for borrowing. The second is their willingness to sell.
Either way, the spike in selling pressure could soon turn ugly for Ethereum.
Ethereum price looks extremely bad from a technical point of view
However, a 35% crash in ETH alone seems highly unlikely, especially without the help of Bitcoin. Also, BTC price is not close to triggering another collapse, at least until the $18,000 support level is breached.
So investors can breathe a sigh of relief and hope that Bitcoin will make the leap. A bullish update amongst a sea of bearish outlooks is that Ethereum sharks and whales holding between 100 and 100,000 ETH have accumulated since March 2022. A total of 1.03% of the ETH supply has been added to these buyers’ bags, indicating that the investors are in an uptrend.

technical view
Should Ethereum bounce off the $1,049 support level and produce a three-day candlestick above the 200-week SMA at $1,200, it would invalidate the bearish thesis described above.
However, after the change, ETH needs to rise and retest the 2017 high of $1,463. In strong bullish moves, Ethereum extends this rally to retest the $1,726 resistance level.