
According to crypto analytics platform Coinglass, Bitcoin fell 56.2% in the second quarter of 2022. This makes it the worst quarter for Bitcoin since the third quarter of 2011, when the BTC price fell 67%. All is not bleak for crypto investors. JPMorgan strategist Nikolaos Panigirtzoglou said the Net Leverage metric suggests that crypto may be on its last legs of leverage reduction. The willingness of crypto companies with stronger balance sheets to bail out distressed crypto firms is also a positive sign. So, will the downtrend continue to attract buyers? What levels will continue to be seen in cryptocurrencies? Here are analyst Rakesh Upadhyay’s analysis of cryptocurrencies such as BTC, SHIB, ETH…
What to expect for Bitcoin?
Bitcoin dropped below the immediate support at $19,637 on June 30, but the long tail on the candlestick indicates strong buying at the lower levels. The bulls tried to build on the momentum from July 1. It tried to push the price towards the overhead resistance of $22,000. However, the long wick on the candlestick indicates that the bears are active at higher levels.
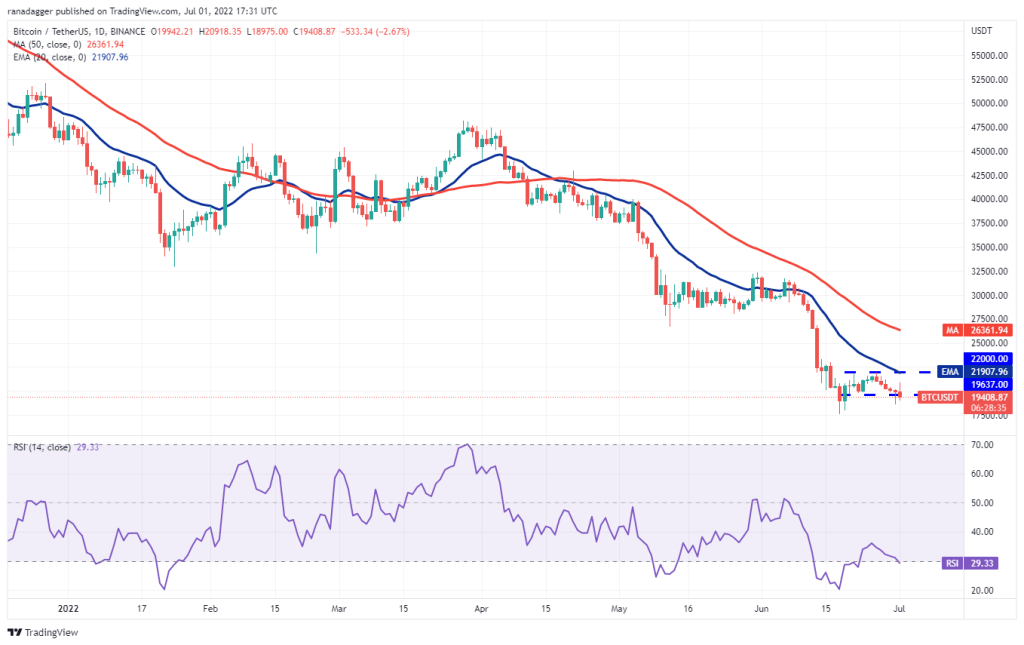
If the price stays below $19,637, the probability of a retest of the critical support at $17,622 increases. The downward sloping moving averages and the relative strength index in the oversold region suggest that the bears are in control. A break and close below $17,622 could signal a resumption of the downtrend. The next support is $15,000. This negative view may be invalidated in the short term if the price rises above the 20-day exponential moving average (EMA) ($21,907). Such a move could clear the way for a possible rally to the 50-day simple moving average (SMA) ($26,361).
What’s next for the biggest altcoin Ethereum?
Ethereum (ETH) broke below the immediate support of $1,050 on June 30. However, the bulls bought the dip. Buyers tried to extend the recovery on July 1, but the long wick on the candlestick indicates that the bears are selling on small rallies. The bears will try to push the price below the psychological level of $1,000. If they are successful, sales can gain momentum. The ETH/USDT pair could decline to key support at $881.
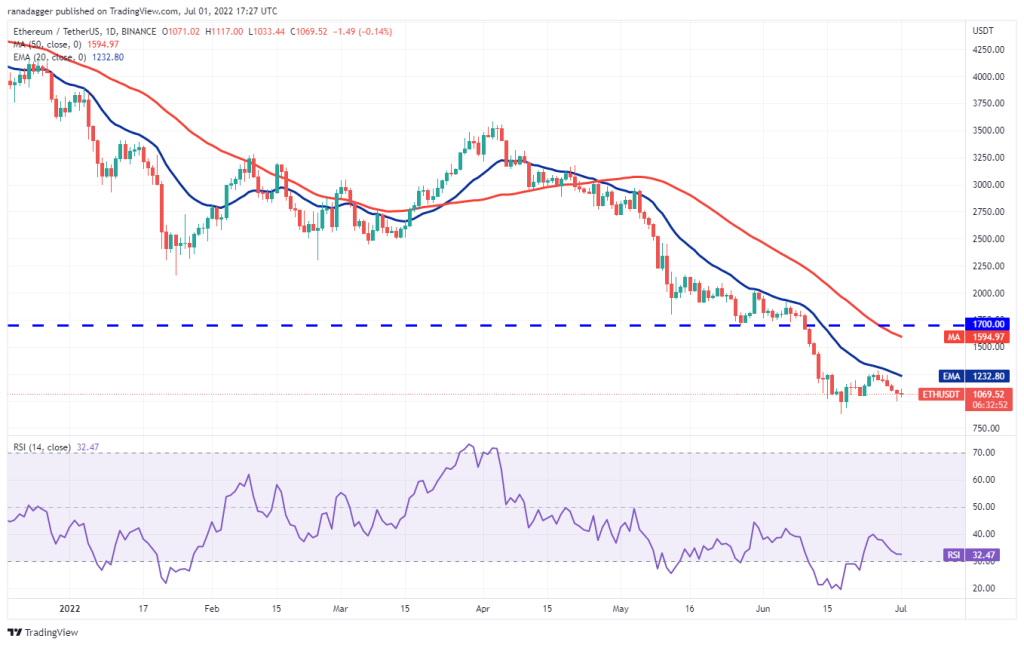
If this level gives way, the pair may continue its downtrend. The next support is at $681. Contrary to this assumption, if the price bounces back from the current level or $1,000, the bulls will try to push the pair above the 20-day EMA. The bullish momentum could start with a break above $1,280.
Coin of the largest cryptocurrency exchange: BNB
BNB broke below the strong support of $211 on June 30, but lower lows attracted strong buying as seen from the long tail on the day’s candlestick. Buyers tried to extend the recovery on July 1, but the long wick on the candlestick indicates that the bears are aggressively defending the 20-day EMA ($234). The falling 20-day EMA and the RSI in the negative zone indicate advantage for the sellers.
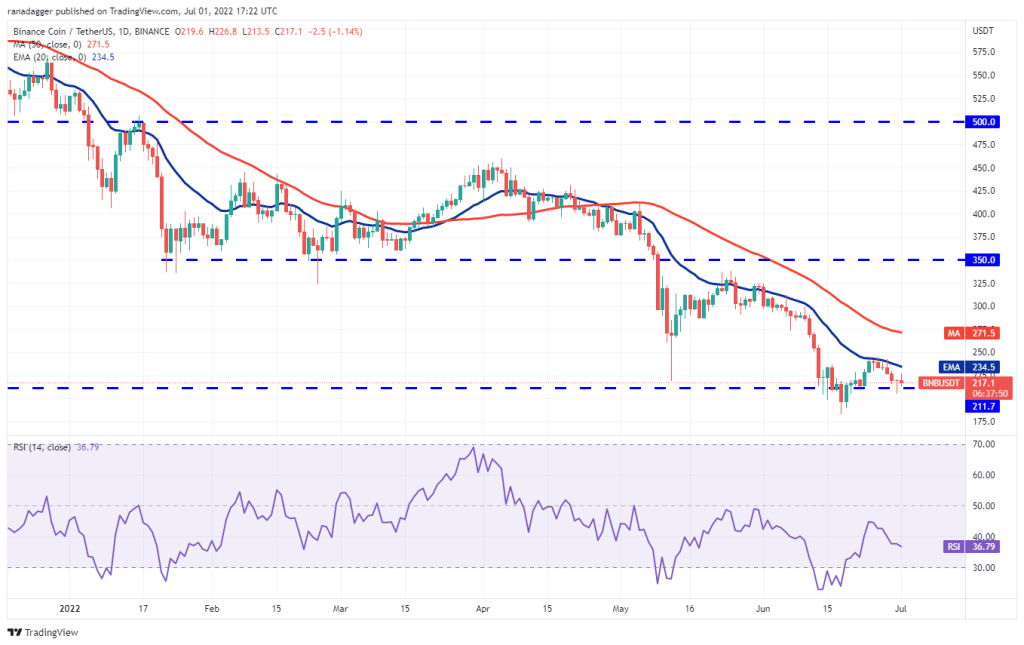
If the price stays below $211, the BNB/USDT pair could retest the crucial support at $183. If this support is broken, the downtrend can resume. The next support is at $150. This negative view may be invalidated in the short term if the price rises and breaks above the 20-day EMA. This could clear the way for a possible rally to the 50-day SMA ($271).
Ripple’s XRP attempts recovery
Ripple (XRP) attempted a recovery on June 30 but the bulls failed to push the price above the overhead resistance at $0.35. This shows that the bears are not willing to give up their advantage.
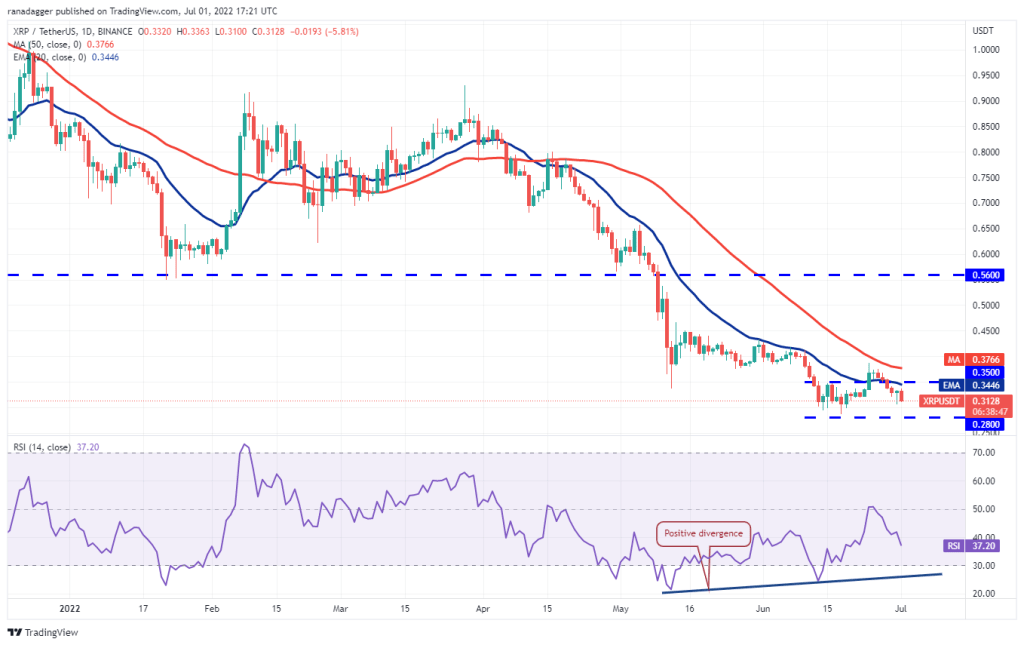
The XRP/USDT pair could drop to strong support at $0.28, where the bulls can form a strong defense. If the price bounces back at $0.28, it indicates that the bulls are continuing to buy lower. The bulls will then make an attempt to push the price above the 50-day SMA ($0.37). Conversely, if the bears sink the price below $0.28, the next leg of the downtrend could begin. The pair could decline to $0.23 later.
What’s next for Cardano?
Cardano (ADA) bounced off $0.44 on June 30, but the bulls failed to clear the 20-day EMA ($0.49) on July 1. This shows that the bears continue to vigorously defend the moving averages.
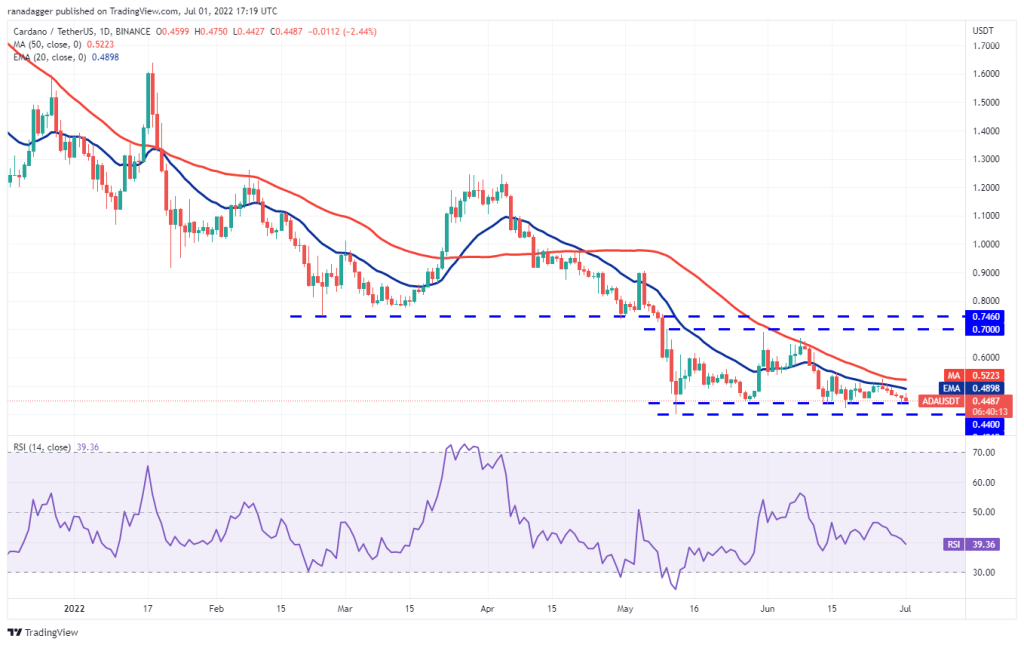
The downward sloping 20-day EMA and RSI in the negative zone indicate that the path of least resistance is to the downside. If the price dips below $0.44, the ADA/USDT pair could decline to the critical support of $0.40. The bulls are expected to defend this level with all their strength because if the support is broken, the pair could resume its downtrend. The next support is at $0.33. Alternatively, if the price bounces back towards $0.44 or $0.40, buyers will again try to break the overhead resistance on the moving averages. If they are successful, the pair could start a relief rally towards $0.70.
Solana couldn’t get past the resistance
Solana (SOL) broke below the immediate support at $33 on June 30, but the long tail on the candlestick indicates strong buying at the lows. Buyers tried to push the price above the 20-day EMA ($36) on July 1, but the bears did not give up.
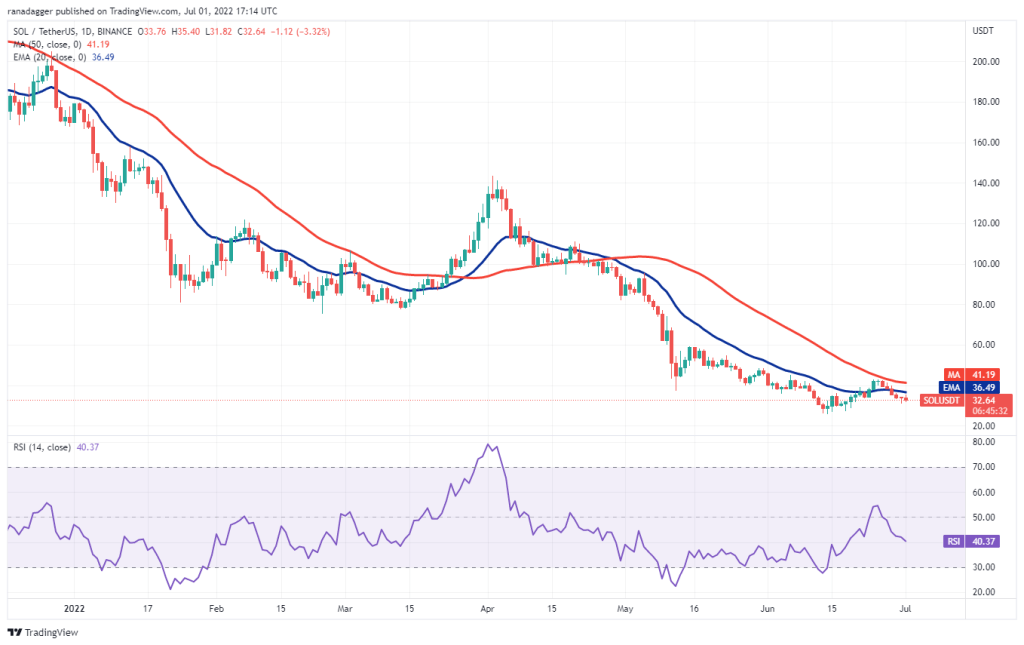
Sellers will try to gain the upper hand by pushing the price below $30. If they do, the SOL/USDT pair could drop to $27 and then to the critical support at $25.86. A break and close below this level could signal a resumption of the downtrend. Another possibility is for the price to bounce back from $30. This will indicate accumulation at lower levels. The bulls will then try to break through the general barrier in the moving averages and push the price towards $50.
Biggest meme coin before Shiba Inu (SHIB): DOGE
Dogecoin (DOGE) is witnessing a fierce battle between bulls and bears near the 20-day EMA ($0.07). The RSI is just below the midpoint and the 20-day EMA has flattened out, indicating a minor advantage for the sellers.
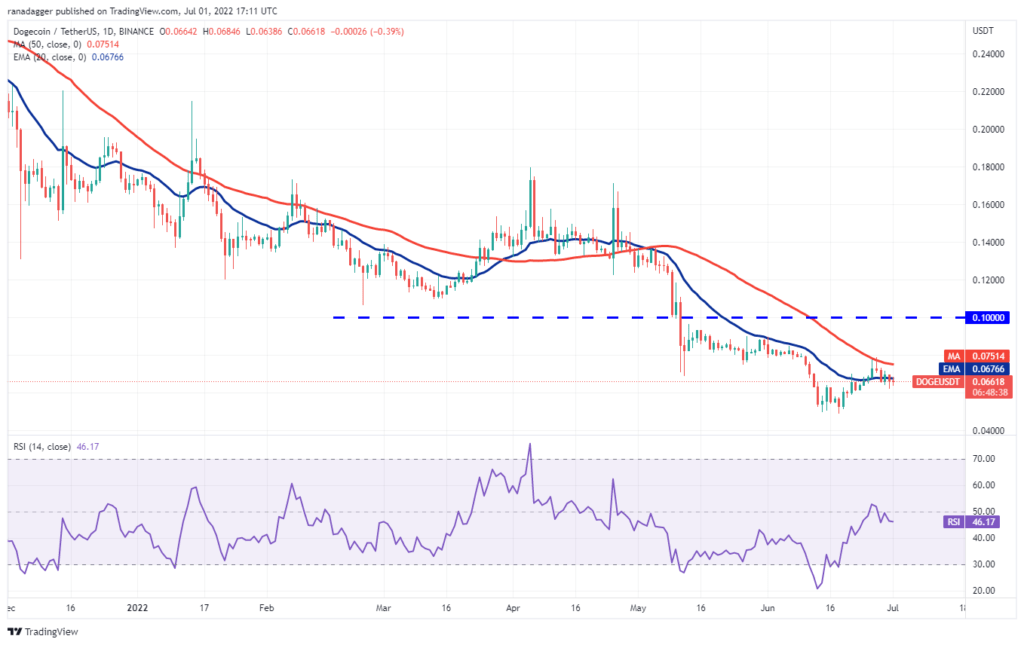
If the price drops below $0.06, it indicates that the bears are back in the driver’s seat. Sellers will then try to push the DOGE/USDT pair below the key support at $0.05 and resume the downtrend. The next support is at $0.04. Conversely, if the price rebounds from the current level, buyers will try to break through the overhead barrier again at the 50-day SMA ($0.08). If they are successful, it suggests the bears may be losing control. The pair could then rise to the strong overhead resistance at $0.10.
Levels to watch out for for Polkadot
Polkadot (DOT) closed below strong support at $7.30 on June 29. Buyers tried to push the price above the level again on June 30 but failed. This shows that the bears are selling on every minor rally. The 20-day EMA ($7.74) has started to drop and the RSI is in the negative territory, which indicates that the bears are dominating. If the price breaks below $6.36, the DOT/USDT pair could start the next leg of the downtrend. The next support is at $5.00.
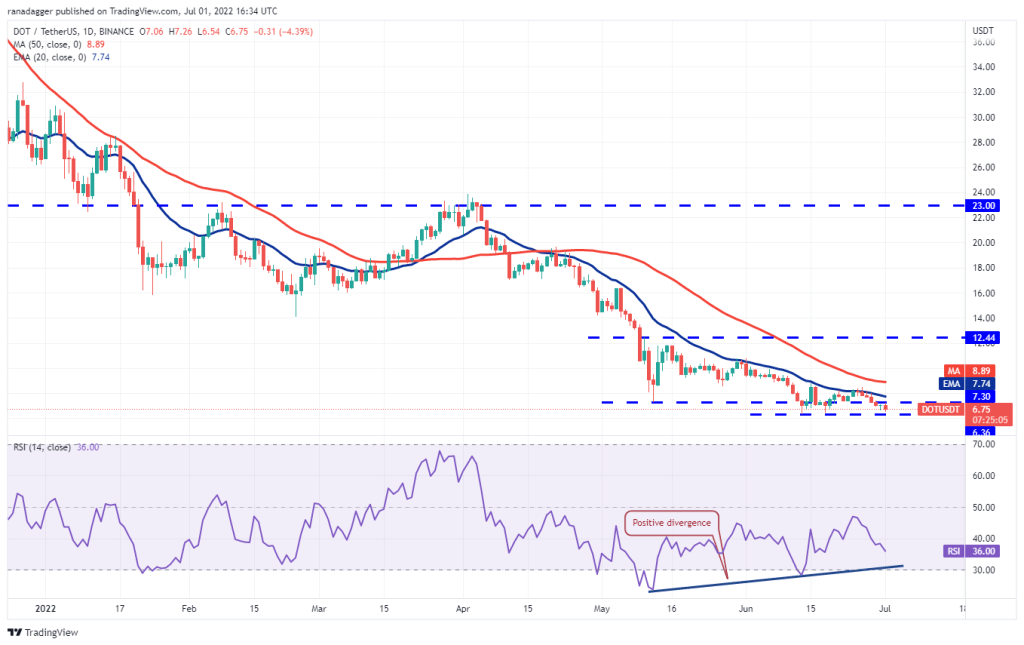
Contrary to this assumption, if the price bounces back from the current level, the bulls will again try to break the overhead resistance at the 20-day EMA. If they are successful, the pair could rally to the 50-day SMA ($8.89).
Pay attention to these levels in the LEO/USD pair
UNUS SED LEO (LEO) turned bearish on June 30 but the bulls did not allow the price to slide back into the bearish channel. This indicates that buyers are trying to turn the resistance line into support. The exit from the channel indicates the start of a new upward move. Buyers pushed the price to $6.50 on July 1, but the long wick on the candlestick indicates that the bears are selling on rallies.
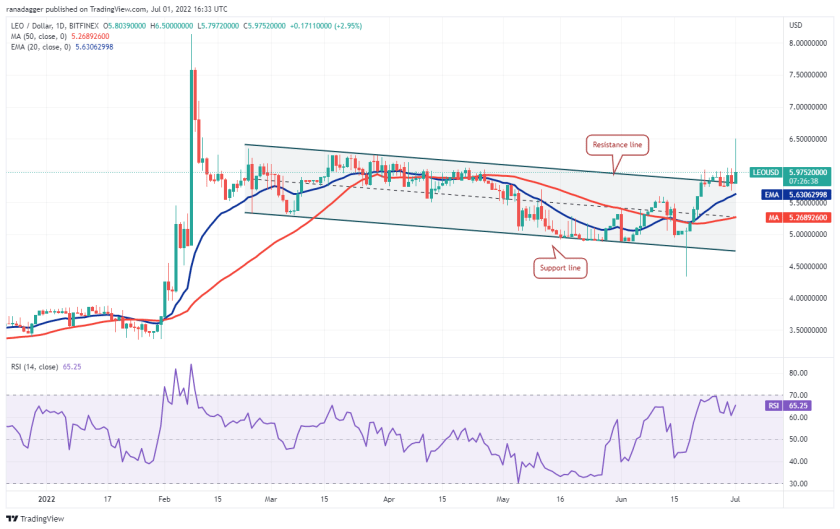
If the bulls hold the price above $6.00, the LEO/USD pair could rise to $6.50 again. If this level is cleared, the rally could extend to the $6.90 pattern target. To invalidate this bullish view, the bears will need to push the price below the 20-day EMA ($5.63). If this happens, the pair could drop to the 50-day SMA ($5.27).
What are the prospects for SHIB?
Shiba Inu (SHIB) closed below $0.000010 on June 28 but bears may continue lower. The bulls bought the dip but are struggling to push the price above the 50-day SMA ($0.00010)
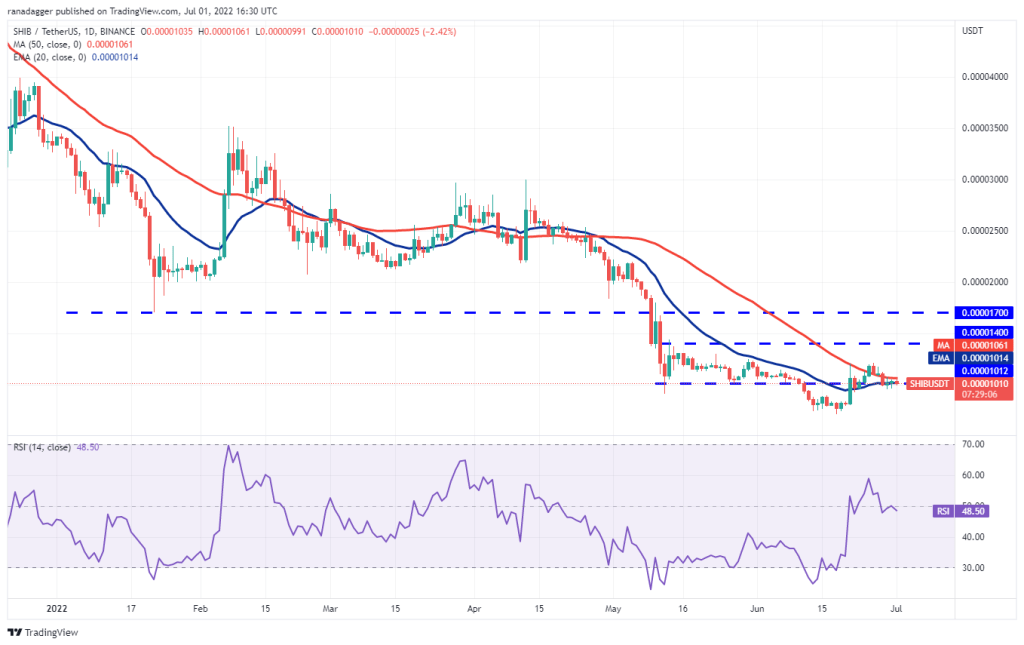
Both moving averages have flattened out and the RSI is just below the midpoint. This indicates a state of equilibrium between buyers and sellers. If the price dips below $0.000009, it will suggest an advantage for the bears. The SHIB/USDT pair could then decline to the critical support of $0.000007. Alternatively, if the bulls push the price above the 50-day SMA, the pair could rally to $0.000012. This level could act as a resistance again but if exceeded, the rally could reach $0.000014.