The ecosystem continues to digest the fallout from the Three Arrows Capital scandal and Voyager Digital’s announcement that it has filed for bankruptcy protection. Hence, trade across Bitcoin and altcoins continues to be suppressed. The data shows that the Bitcoin (BTC) price is spending the day fluctuating around the $20,000 support level, ranging from a low of $19,775 to $20,480. So, what levels are next? Here are the comments of 5 analysts…
Analysts pointed out the repeating pattern in the Bitcoin chart
A prominent pattern on the Bitcoin chart prior to the pullbacks that have occurred since November 2021 was noted by analyst Mustache. The analyst stated that Bitcoin exhibits the same pattern before each drop. But he said the descending triangle is getting smaller and smaller. So, it pointed to the $14,000-16,000 levels in case another downtrend is seen.
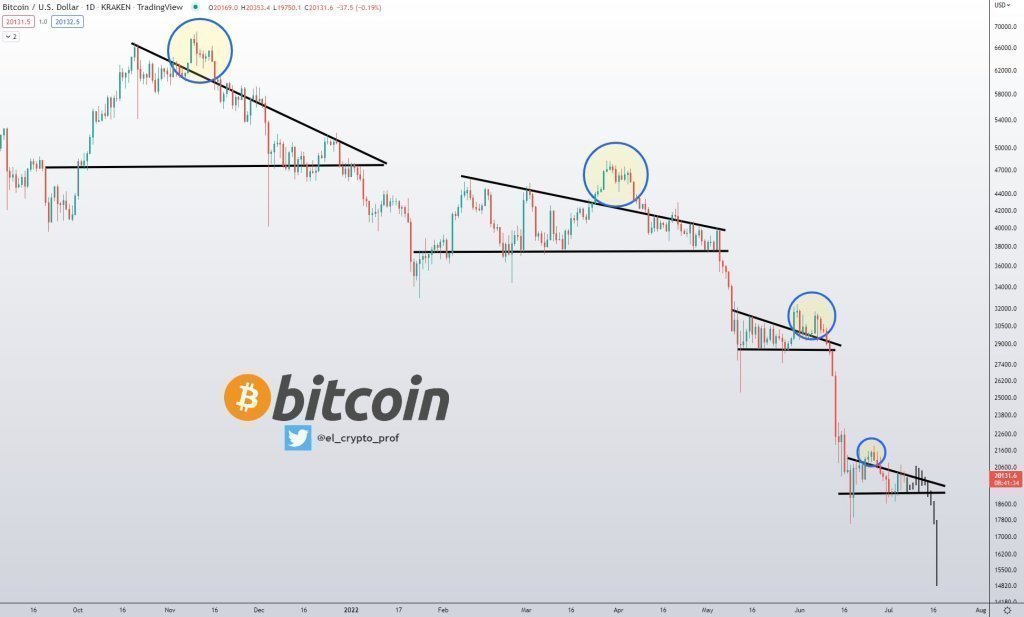
Well-known market analyst Peter Brandt also recently highlighted the recurring pennant pattern on the Bitcoin chart. However, he did not say in which direction the price might move once the formation is complete.
When it looks like a pennant and acts like a pennant it is often a pennant $BTC pic.twitter.com/O7RtnvFSp0
— Peter Brandt (@PeterLBrandt) July 5, 2022
As the market seeks bottom, the number of addresses increases
Recently, one of the most popular conversation topics on Twitter was predicting the Bitcoin price bottom. According to crypto research firm Delphi Digital, Bitcoin has closed below its weekly average of 200 for four consecutive weeks, a development that historically “marks previous market bottoms.” On whether Bitcoin investors should expect a rapid recovery, Delphi Digital said, “this is the longest time BTC has been below the 200-weekly average.”
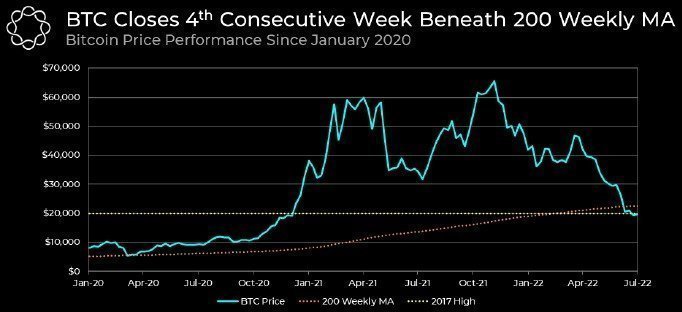
He also emphasized that “Bitcoin’s weekly correlation coefficient remains inversely proportional to the US Dollar.” The correlation hit a 17-month low of -0.77. A strong dollar suggests that the Bitcoin price will continue to struggle along with other assets. Meanwhile, Delphi Digital highlighted an encouraging development that shows that BTC adoption continues to increase. Delphi Digital used the following statements:
As prices continue to drop, the number of BTC addresses accumulating BTC continues to increase. Addresses holding at least one BTC hit an all-time high of 877,501.
Some traders predict sideways movement for the rest of 2022
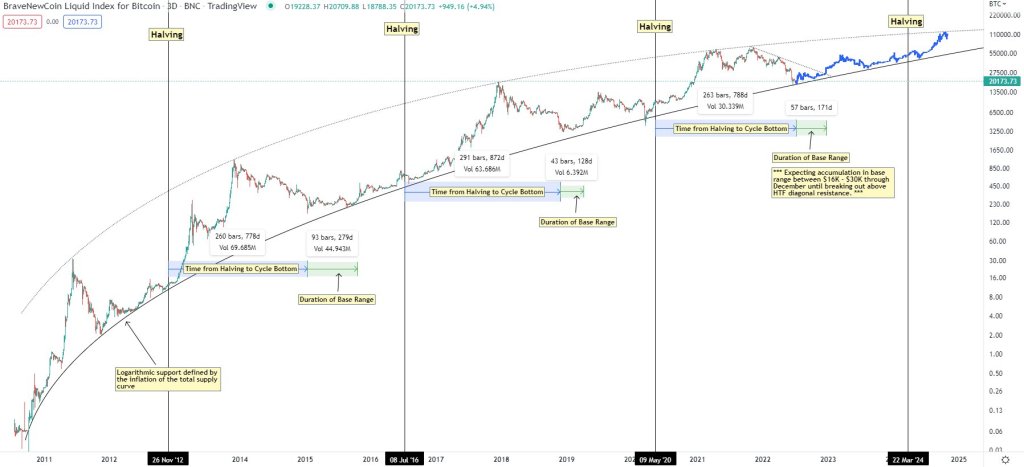
A macro view of what Bitcoin’s past performance suggests for its future was provided by market analyst and pseudonymous Twitter user KALEO, who posted the chart below outlining previous market cycles. Based on the chart provided and the predicted path, Kaleo suggested that the market will continue to trade sideways for the foreseeable future. The analyst used the following statements:
The next most likely path is to see a key range established between $16,000 and $30,000, which was resolved around December when the price finally broke above the HTF cross resistance.
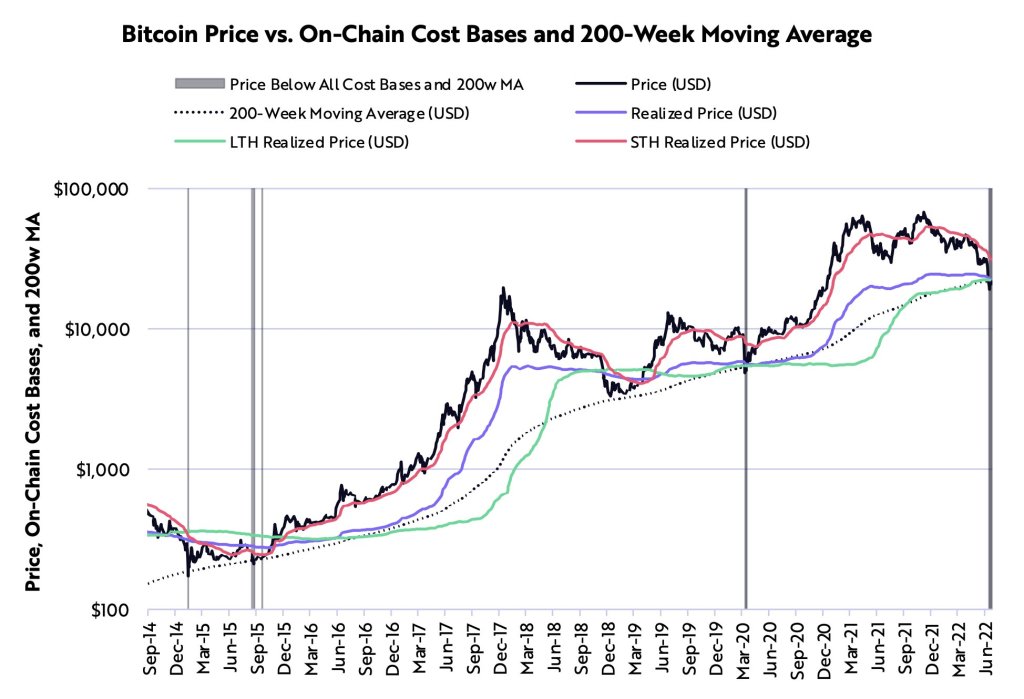
Ark Investment analyst: There are multiple bottom signals in Bitcoin
Finally, according to ARK Investment Management analyst Yassine Elmandjra, Bitcoin (BTC) is flashing multiple bottom symbols. Elmandjra states that BTC is trading below the short and long-term cost floors of the 200-week moving average (MA). According to the analyst, such a thing has only happened for the fourth time in Bitcoin’s price history.
Elmadjra also says that BTC miners are dealing with pressure. Additionally, the analyst states that net losses in Bitcoin recently hit a two-year low. Elmadjra says that macroeconomic conditions are in a downward trend and uses the following statements:
Macro conditions still weigh heavily on BTC’s outlook. Credit default swaps have more than doubled since September, and the yield curve is flattening. Despite the signs of recession, the Fed is still hawkish. If it continues to tighten, at-risk assets like BTC could continue to suffer.