
This week, Bitcoin (BTC)’s 150-day EMA is set to close below its 471-day EMA for only the third time in history. One indicator is giving a similar signal to the 2015 and 2018 bear market bottoms. Accordingly, it is possible for Bitcoin to experience a major price recovery in the coming months.
What is the Bitcoin Pi Cycle alt indicator?
The indicator is called the ‘Pi Cycle base’. It also consists of the 471-day simple moving average (SMA) and the 150-period exponential moving average (EMA). Also, the 471-day SMA is multiplied by 0.745. The result is compared to the 150-day EMA to predict the bottom of the underlying market.
Specifically, every time the 150-period EMA falls below the 471-period SMA, it marks the end of the Bitcoin bear market. For example, the transition in 2015 coincided with Bitcoin bottoming around $160 in January 2015. This was followed by an almost 12,000% bull run towards $20,000 in December 2017.
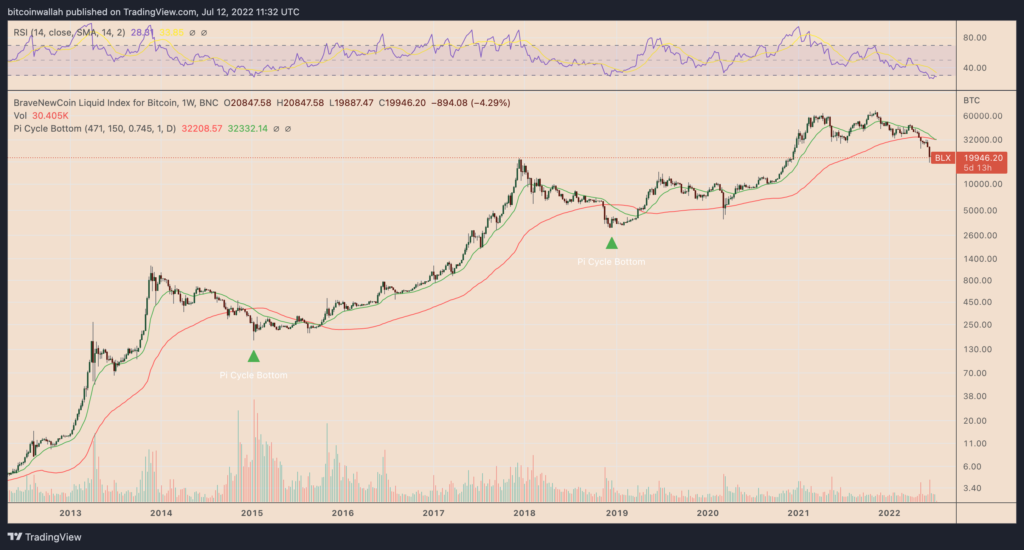 BTC weekly price chart with ‘Pi cycle dip’ indicator / Source: TradingView
Similarly, the second 150-471 MA crossing in history marked the end of the 2018 bear cycle. It also rose from around $3,200 in December 2018 to $69,000 in November 2021. This means a price increase of 2,000%.
Only the third time in history
Bitcoin will close this week below its 150-day EMA ($32,332 as of July 12), below its 471-day EMA ($32,208). So it will record the third Pi Cycle bottom in its history.
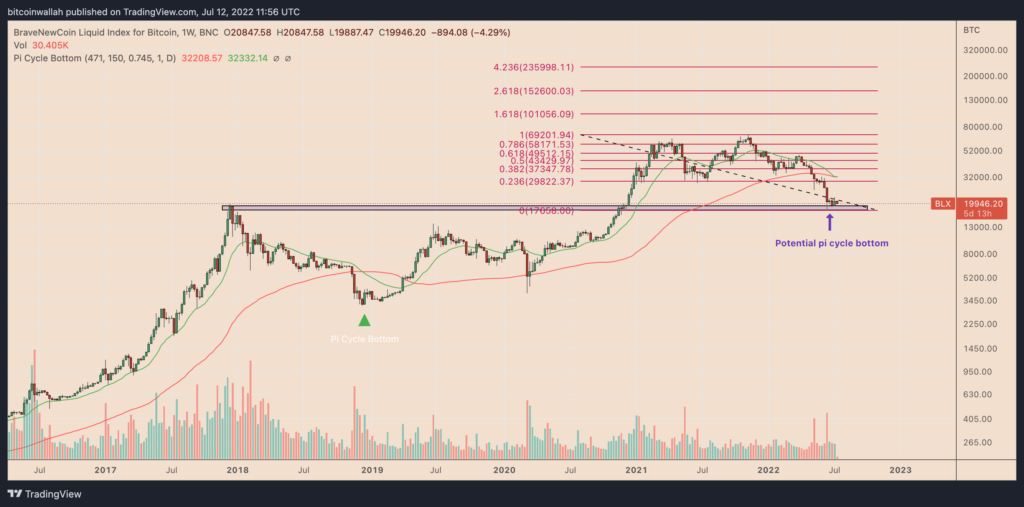 BTC weekly price chart showing the bottom of the next potential cycle / Source: TradingView
Bitcoin slumped $20,000 with a price correction of more than 75% from its high of $69,000. The transition also took place while BTC was swinging around this level. cryptocoin.com As you follow, BTC has been flirting with this level for almost a month. The latest MLIV Pulse poll states that its price is more likely to drop to $10,000 than to bounce back to $30,000.
The failure of several high-profile companies has led to an ongoing crypto market carnage. Therefore, fears arose in the market.
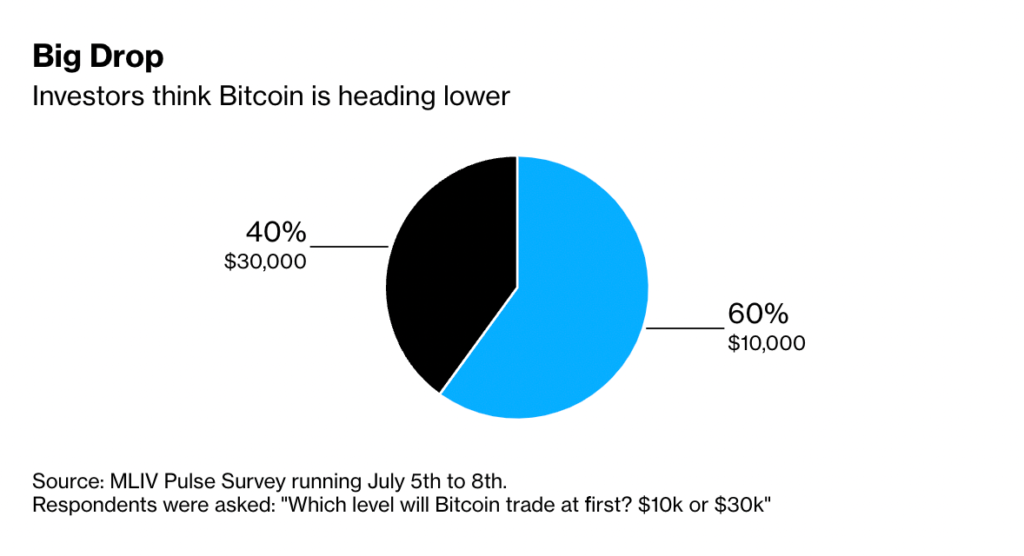 MLIV Pulse Survey results on Bitcoin’s next trend / Source: Bloomberg
Meanwhile, hawkish central bank policies focused on extracting excess cash from the economy are also scaring investors. However, according to experts, if the given alt fractal plays, it is possible for Bitcoin to return to at least $30,000. The temporary upside target coincides with the 0.236 Fib line of the Fibonacci retracement chart from the $69,000 high to the $17,000 low as shown in the chart above.