Hammer candlestick patterns are one of the most used patterns in technical analysis. Not just in crypto, but also in stocks, indices, bonds and forex trading. Hammer candles can help price action traders spot potential reversals after uptrends or downtrends. Depending on the context and time frame, these candlestick patterns can indicate a bullish reversal at the end of a downtrend or a bearish reversal after an uptrend. Along with other technical indicators, hammer candles can provide traders with good entry points for long and short positions.
Ascending hammer candles are a hammer and inverted hammer pattern that occurs after a downtrend. The bearish variation of hammer candles is the hanging man and shooting star pattern that occurs after an uptrend.
What is Hammer Pattern?
The hammer pattern is a pattern that works well in various financial markets. It is one of the most popular candlestick patterns that traders use to gauge the probability of results when looking at price action.
Combined with other trading methods such as fundamental analysis and other market analysis tools, the hammer candle pattern can provide insight into trading opportunities.
How does the Candle Formation work?
In a candlestick chart, each candle relates to a period according to the timeframe you have chosen. If you look at a daily chart, each candle represents a day’s trading activity. If you look at a 4-hour chart, each candle represents 4-hour trades.
Each candle has an opening price and a closing price that form the candle body. It also has a wick (or shadow) that shows the highest and lowest prices for that period.
What is the Hammer Candle Pattern?
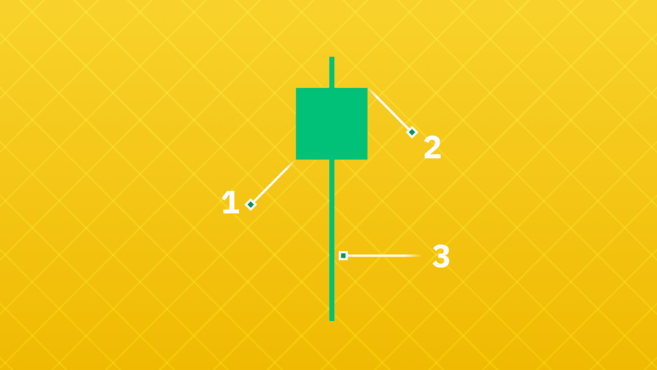
A hammer candle is formed when a candle shows a small body along with a long lower wick. The wick (or shadow) must be at least twice the size of the candle body. The long lower shadow indicates that sellers are pushing the price down before buyers push it above the open price.
Below you can see the opening price (1), the closing price (2) and the ups and downs forming the wick or shadow (3).
bull hammers
Hammer Candle Pattern
A bullish hammer occurs when the closing price is above the opening price, indicating that buyers have control over the market before the end of that trading period.
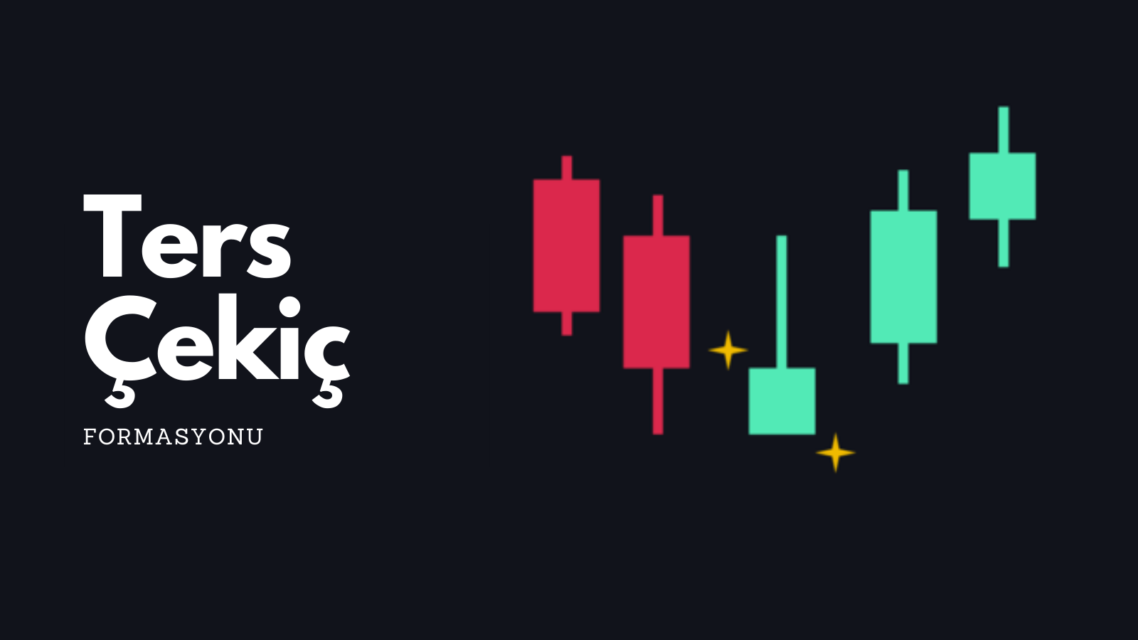
Inverted Hammer Candlestick Pattern
An inverted hammer occurs when the opening price falls below the closing price. The long wick above the body indicates buying pressure trying to push the price higher, but eventually pulled back before the candle closed. While the regular hammer is not as bullish as the candle, the inverted hammer is also an upward reversal pattern that occurs after a downtrend.
Bear Hammers
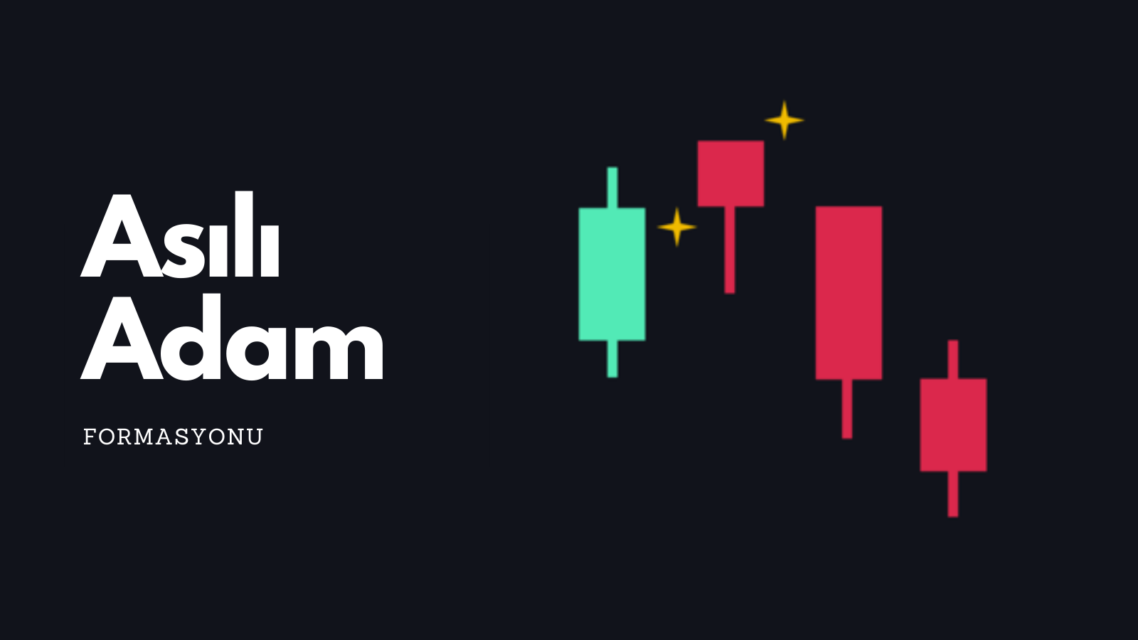
Hanging Man Candle Pattern
The bear is known as the man who hangs the hammer candlestick. It occurs when the opening price is above the closing price, resulting in a red candle. A wick on a bearish hammer indicates that the market is experiencing selling pressure, which indicates a potential reversal to the downside.
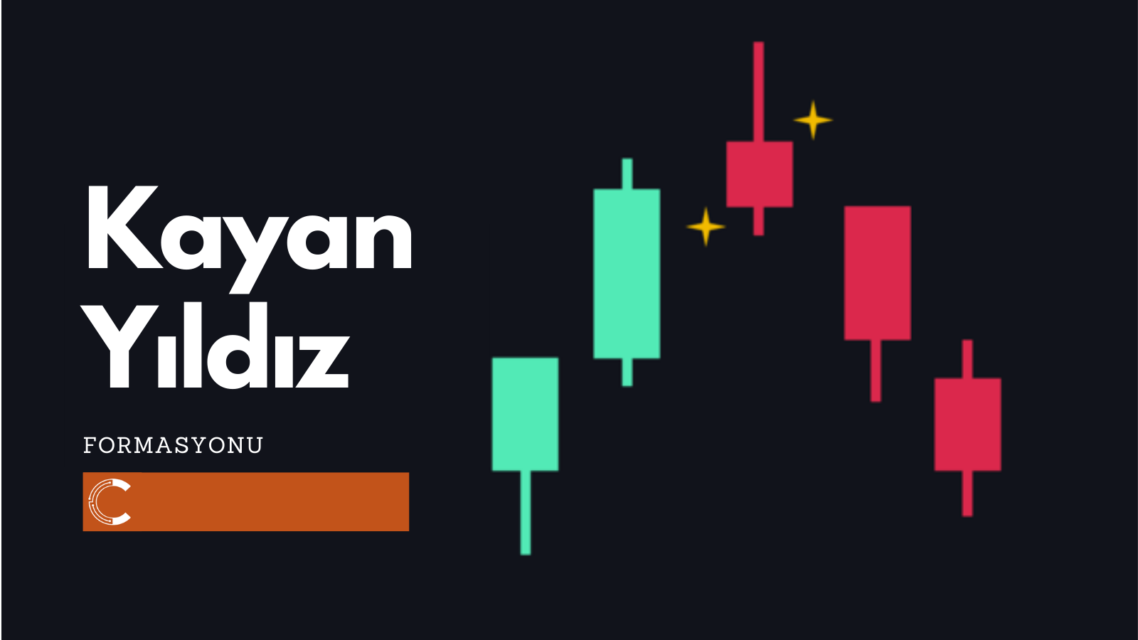
Shooting Star Candle Pattern
The falling reverse hammer is called the shooting star candlestick. It looks like a normal inverted hammer, but indicates a potential downtrend rather than an uptrend. In other words, shooting star candlesticks are like inverted hammers that form after an uptrend. They are formed when the opening price is above the closing price and the wick indicates that the upside market movement may be coming to an end.
How to use hammer candlestick patterns to spot potential trend reversals?
Bullish hammer candles occur during downtrends and signal the bottom of the downtrend, signaling a potential price reversal.
It could be a falling hammer candle, a hanging man, or a shooting star. These appear after uptrends and indicate a potential reversal to the downside.
Therefore, to use hammer candles in trading, you need to consider their position relative to the previous and next candlesticks. The reversal pattern is either discarded or validated depending on the context.
Strengths and weaknesses of hammer candlestick patterns
Each candlestick pattern has its pros and cons. After all, no technical analysis tool or indicator can guarantee 100% profit in any financial market. Hammer candlestick chart patterns tend to work better when combined with other trading strategies such as moving averages, trend lines, RSI, MACD, and Fibonacci.
Strong
The hammer candlestick pattern can be used to detect trend reversals in any financial market.
Traders can use hammer candles on multiple timeframes, making them useful in day trading.
Weakness
Hammer candlestick patterns are context dependent. There is no guarantee that trend reversals will happen.
Hammer candle formations are not very reliable on their own. Investors should always combine them with other strategies and tools to increase their chances of success.
Hammer Candlestick vs Doji: What’s the Difference?
Dojis are like hammers without a body. A Doji candlestick opens and closes at the same price. A hammer candlestick indicates a possible price reversal, while a Doji usually suggests consolidation, continuation or market indecision. Doji candles are generally neutral patterns, but in some cases they can precede bullish or bearish trends.
The Dragonfly Doji looks like a hammer or hanging man without his body.
The tombstone Doji resembles an inverted hammer or a shooting star.
Yet hammers and Dojis don’t say much on their own. You should always consider context such as market trend, surrounding candles, trading volume and other metrics.
Final Words
While the hammer candle pattern is a useful tool to help traders spot potential trend reversals, these patterns alone are not necessarily a buy or sell signal. Similar to other trading strategies, hammer candles are more useful when combined with other analysis tools and technical indicators.
You should also take advantage of appropriate risk management by evaluating the reward ratio of your trades. You should also use stop-loss orders to avoid big losses in moments of high volatility.