
Traders are still buying in BTC and major altcoins on every dip. But selling near the overhead resistance could be a sign that price action will remain range-bound in the short term. Is it possible for major altcoins, including Bitcoin and DOGE, to extend their recovery in the short term? Crypto analyst Rakesh Upadhyay examines the 10 biggest cryptocurrencies to find out.
An overview of the crypto market
In a bear trend, the market’s failure to react negatively to bearish news is a sign that sales may be exhausted. Reports that electric vehicle maker Tesla dumped 75% of its Bitcoin (BTC) holdings in the second quarter caused only a minor drop as the lows drew strong buying from the bulls.
cryptocoin.com As you follow, Tesla wasn’t the only institution selling its Bitcoin. Arcane Research analyst Vetle Lunde highlighted in a Twitter thread that large institutions have sold 236,237 BTC since May 10. It is encouraging to see that Bitcoin is doing quite well, even after massive corporate sales and the unfavorable macro environment.
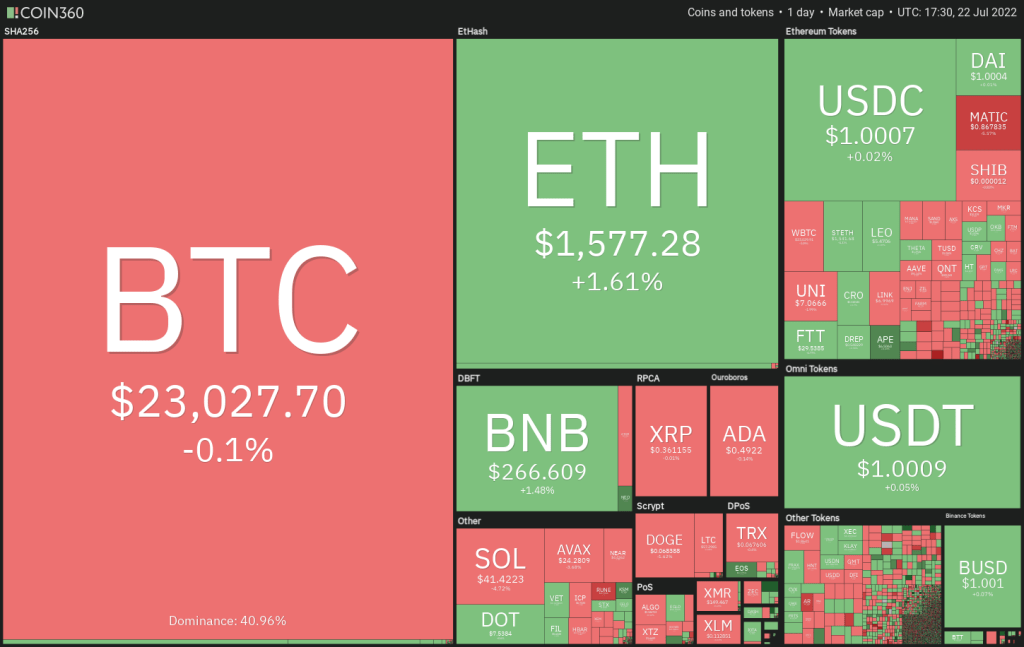
Daily cryptocurrency market performance. Source: Coin360
The current bear market is giving new investors the opportunity to enter at lower levels. According to a report by Boston Consulting Group, Bitget and Foresight Ventures, 25% of individual wealth is in stocks. By contrast, 0.3% is parked in crypto. This shows that crypto is still in the early stages of adoption compared to legacy markets. Now it’s time for analysis…
BTC, ETH, BNB, XRP and ADA analysis
Bitcoin (BTC)
Bitcoin fell below the 50-day simple moving average (SMA) ($22,683) on July 21. However, the bulls aggressively bought the dip, as seen by the long tail on the day’s candlestick. Buyers are currently trying to keep the price above the overhead resistance at $23,363.
The rising 20-day exponential moving average (EMA) ($21,729) and the relative strength index (RSI) in the positive zone suggest the path of least resistance is up. If the bulls propel the price above the $23,363 and $24,276 resistance zone, further bullish momentum is likely to increase. Thus, it is possible for BTC to rally to $28,171 and then to $30,000.
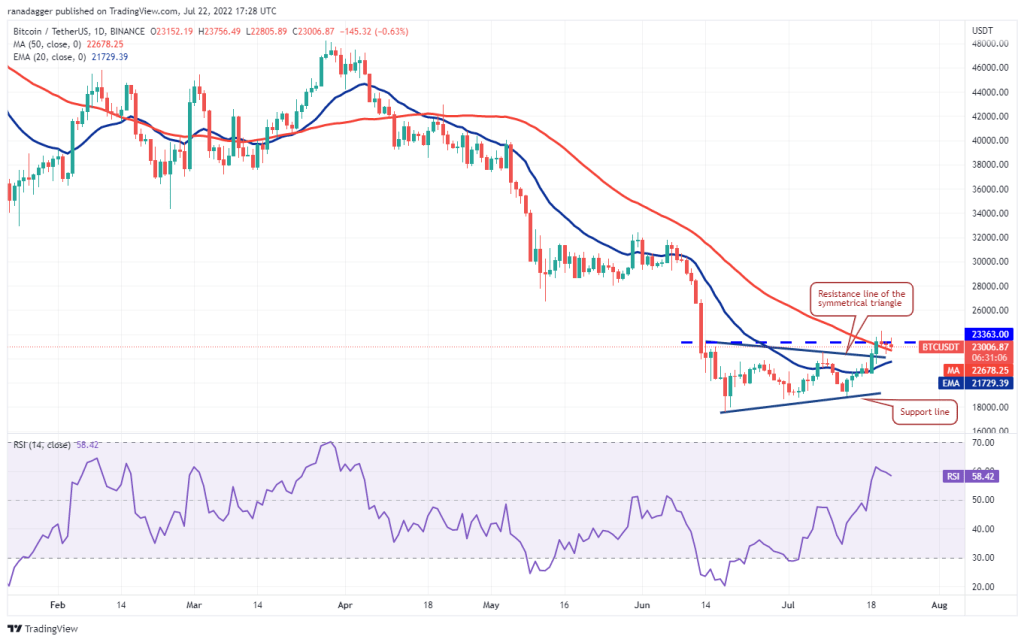
Contrary to this assumption, if the price drops and dips below the 20-day EMA, it will indicate that the bears have not given up yet. Sellers will then try to sink BTC to the support line. A break and close below this support is likely to turn the advantage in favor of the bears.
Ethereum (ETH)
ETH’s retrace ended on July 21 at $1,605. This shallow correction shows that traders are in no rush to close their positions as they expect the upward movement to continue.
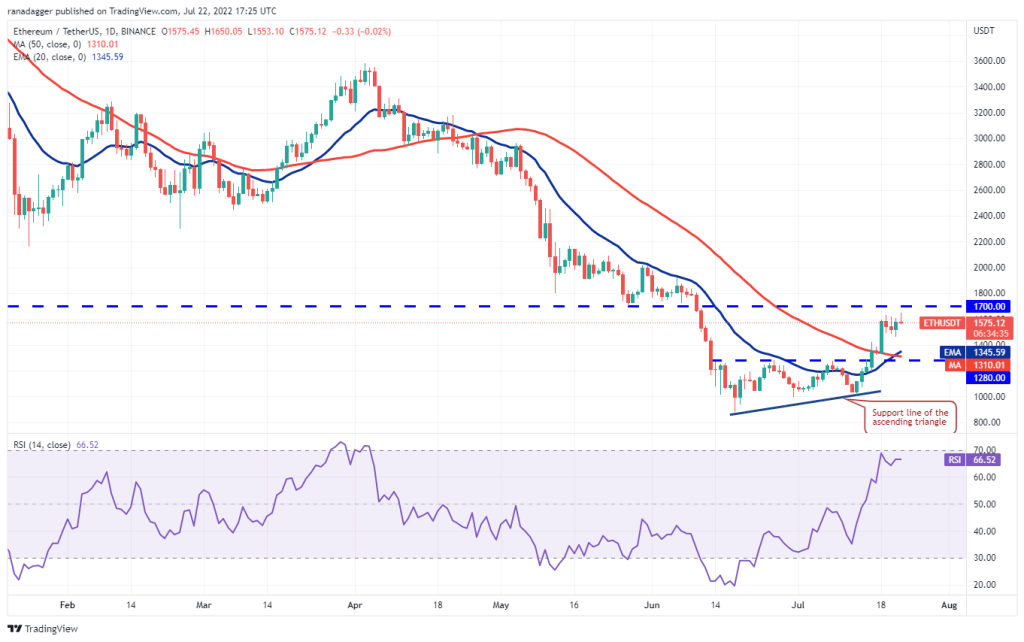
The rising 20-day EMA ($1,345) and the RSI near the overbought zone point to an advantage for buyers. The bulls will try to push the price above the overhead resistance at $1,700. If they are successful, it is possible for ETH to gain momentum and rise to the psychological level of $2,000.
Alternatively, if the price drops from $1,700, it indicates that the bears are defending this level aggressively. ETH is likely to consolidate between $1,600 and $1,700 for a few days later. However, a break below this support is likely to pull ETH to the 20-day EMA.
Binance Coin (BNB)
BNB’s correction took support near the 20-day EMA ($247) on July 21. This shows that the bulls are accumulating on the declines. Buyers will try to push the price above the downtrend line and continue the upward move.
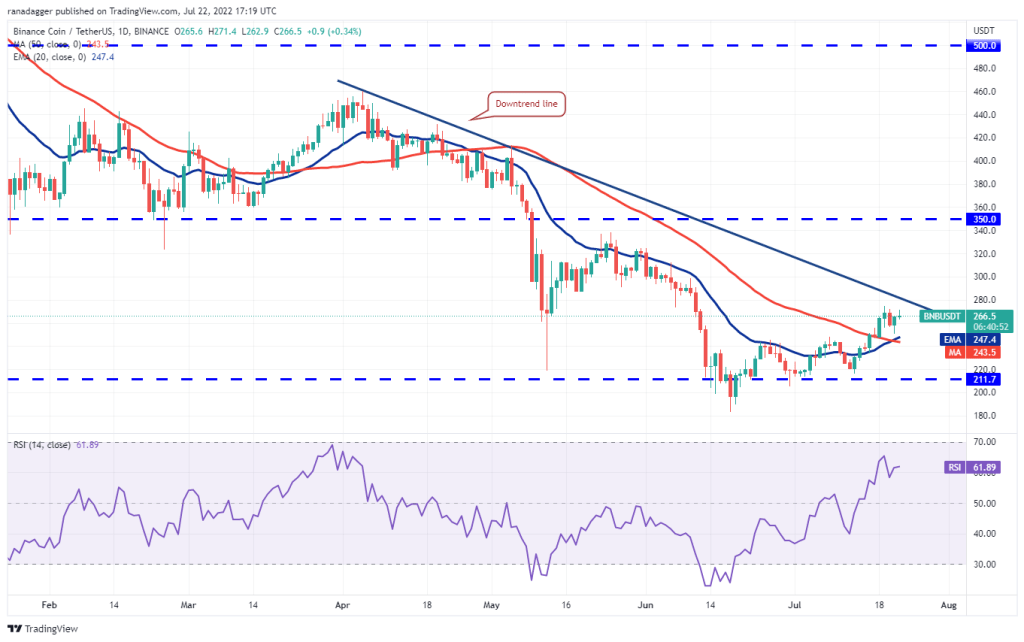
The bullish cross in the moving averages and the RSI in the positive zone suggest that the bulls have the upper hand. If the price rises above the downtrend line, BNB is likely to rise to $300 and then $325. Conversely, if the price turns down from the downtrend line, it indicates that the bears are vigorously defending the level. However, if the bulls do not give up too much of this level, the probability of a breakout increases. This bullish view could be rejected with a break below the 50-day SMA ($243).
Ripple (XRP)
XRP’s long tail on the July 21 candlestick shows that the bulls are buying on dips to the moving averages. This is a sign that sentiment is shifting from selling on rallies to buying on dips.
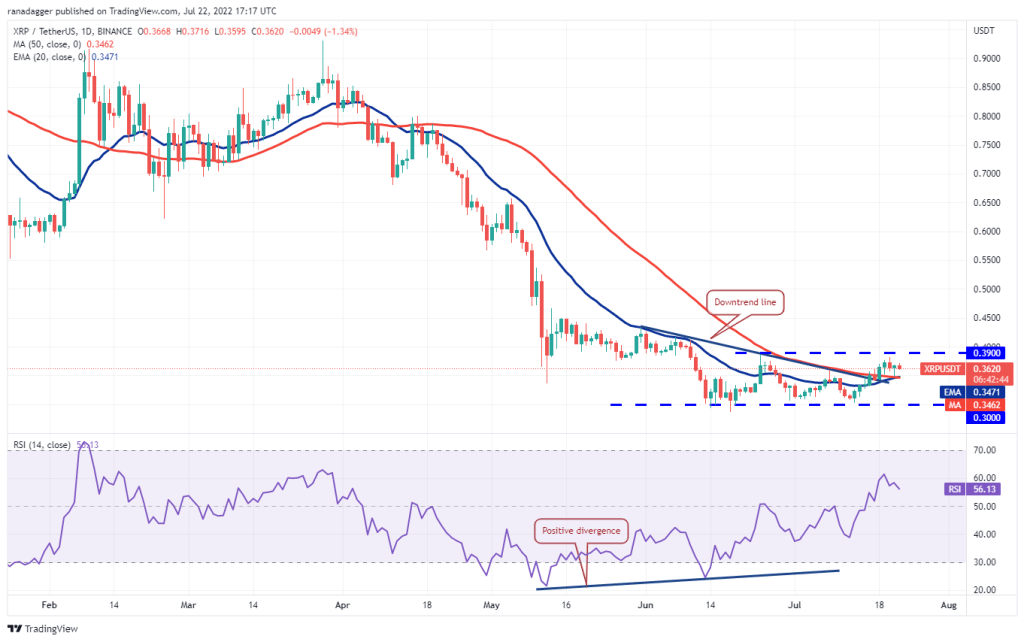
The slowly rising 20-day EMA ($0.35) and the RSI in the positive zone point to an advantage for buyers. The bulls will try to push the price above the immediate resistance at $0.39. If successful, it is possible for XRP to extend its rally from $0.45 to the stiff overhead resistance. Bears can pose a strong challenge at this level. A break below the moving averages will invalidate the bullish view. XRP is likely to consolidate in a wide range between $0.30 and $0.39 for a few days later.
Cardano (ADA)
ADA broke below the 50-day SMA ($0.49) on July 20. However, the bears failed to push the price below the 20-day EMA ($0.47). This suggests that lower levels are attracting buyers.
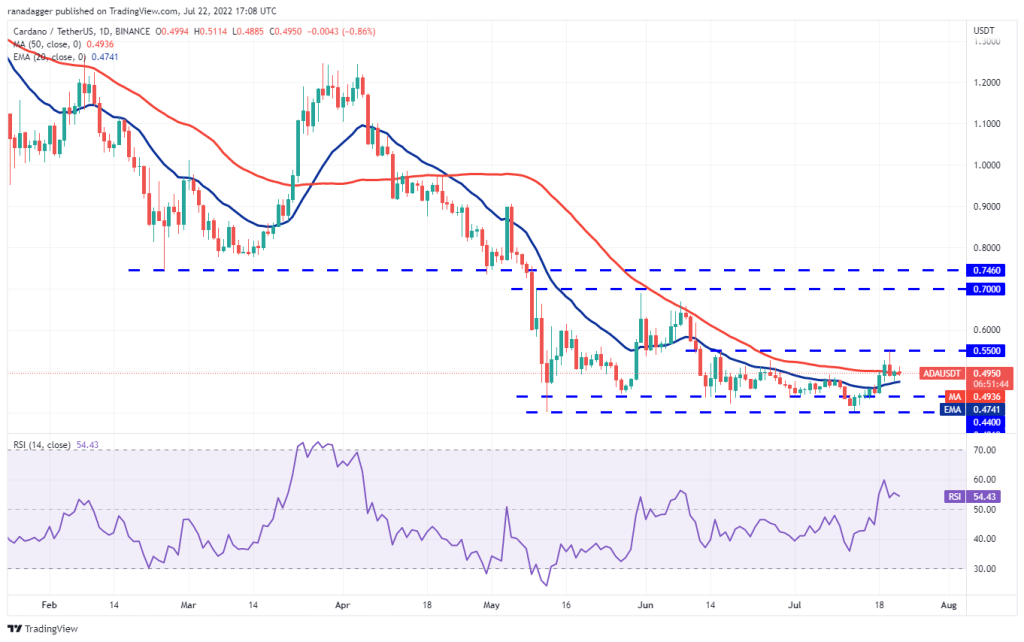
The slowly rising 20-day EMA and the RSI in the positive zone suggest that the bulls have a slight advantage. Buyers will make another attempt to clear the overhead resistance at $0.55. If successful, it is possible for ADA to pick up momentum and start the march northward towards $0.70. Conversely, if the price declines and dips below the 20-day EMA, ADA is likely to consolidate between $0.44 and $0.55 for a few days.
SOL, DOGE, DOT, MATIC and AVAX analysis
Left (LEFT)
SOL pullback from $48 level held support at 20-day EMA ($39). Buyers tried to push the price above the overhead resistance on July 22. However, it faced heavy selling pressure at higher levels.
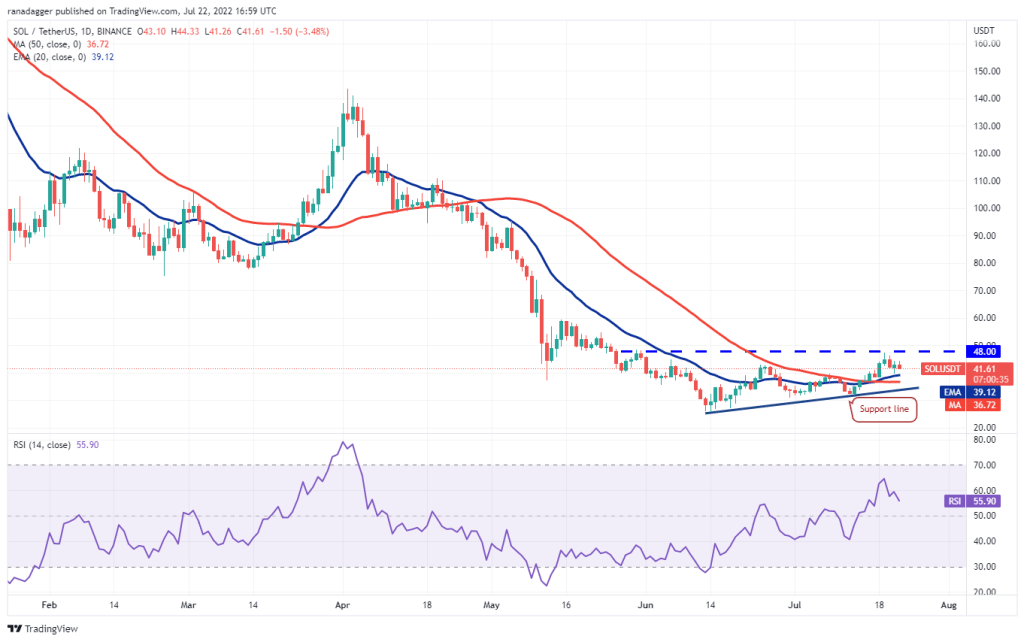
If the price breaks down from the current level or overhead resistance, the SOL is likely to drop to the moving averages. It is also likely to spend some more time inside the ascending triangle pattern. A break below the support line will invalidate the bullish setup. That will put the bears back in the driver’s seat.
Conversely, if the price bounces back from the 20-day EMA, buyers will make another attempt to break through the overhead barrier at $48. If they achieve this, the triangle pattern will be completed. It is possible that SOL will start to rise to $60 later. If this hurdle is cleared, the next stop is likely to be the $71 pattern target.
Dogecoin (DOGE)
The bears tried to push Dogecoin (DOGE) below the 20-day EMA ($0.07) on July 21. But the bulls bought the dip aggressively, as seen from the long tail on the candlestick.
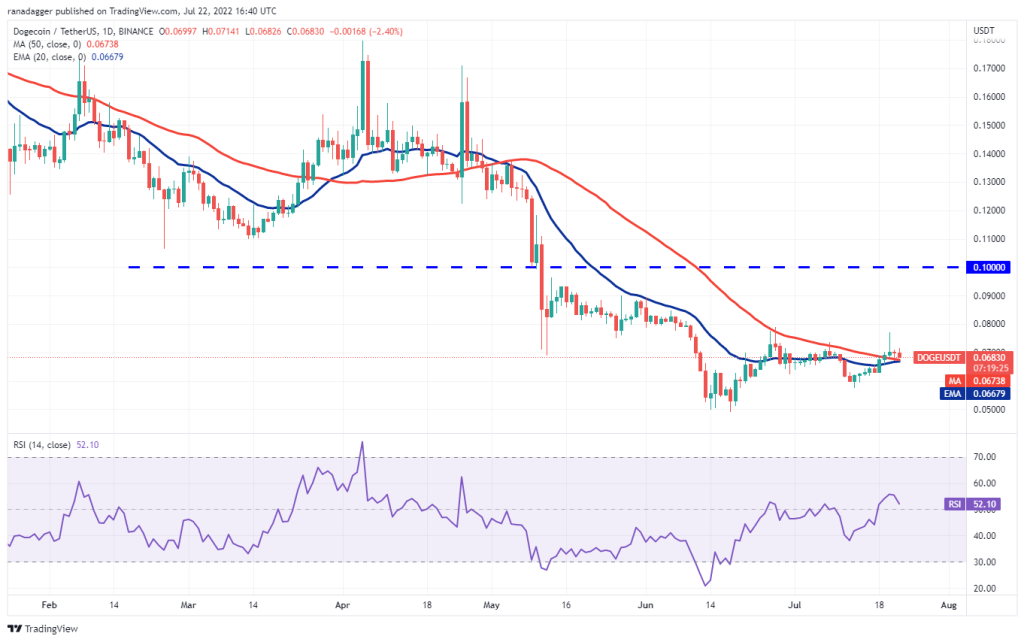
This increases the likelihood of a break above the overhead resistance at $0.08. If that happens, DOGE could rally to $0.09 and then to $0.10. The horizontal 20-day EMA and RSI in the positive zone point to a minor advantage for buyers. Contrary to this assumption, DOGE price drop from $0.08 would indicate that the bears continue to sell higher. It is possible that this will keep Dogecoin (DOGE) between $0.08 and $0.06 for a while.
Polkadot (DOT)
The DOT fell to the 20-day EMA ($7.25) on July 21. However, the long tail on the day’s candlestick indicates that the bulls are buying lower.
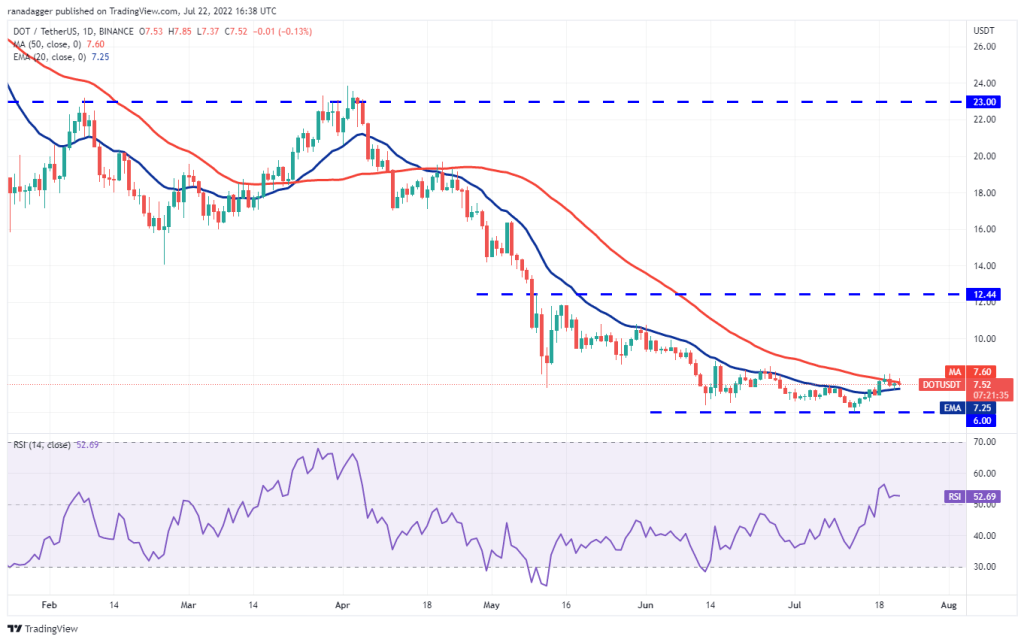
A bounce from the 20-day EMA is a positive sign, increasing the likelihood of a break above $8.08. If this happens, it is possible for the DOT to continue rallying and rally to $8.79 and then to the psychological level of $10. Contrary to this assumption, if the price drops from the current level or $8.08, it will indicate that demand is drying up at higher levels. The bears will then try to push the price below the 20-day EMA. Therefore, the bears will challenge the important support at $6.
Polygon (MATIC)
MATIC is in an uptrend. The retracement that started at $0.98 on July 19 has recovered from the 38.2% Fibonacci retracement level of $0.80. This shows that the sentiment is positive and traders are buying on the dips.
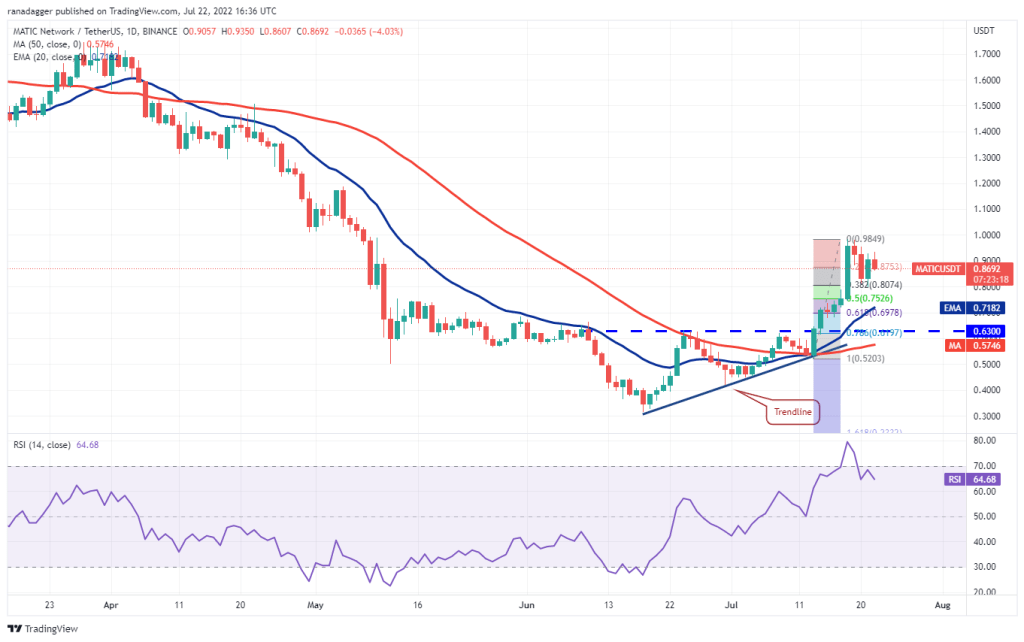
The rising 20-day EMA ($0.72) and the RSI in the positive zone suggest that the buyers have prevailed. A rally to $0.98 is possible for MATIC, which the bears could attempt to stop the recovery. If the price drops from this level, MATIC is likely to stay at the border between $0.80 and $0.98 for a few days. Alternatively, if buyers push the price above $0.98, bullish momentum is likely to increase and MATIC is likely to rise to $1.26. The bears will have to push the price below the 20-day EMA to gain the upper hand.
Avalanche (AVAX)
AVAX dropped from $26 on July 20. However, the bears failed to push the price to the breakout level of $21.35. This indicates that the bulls are buying on small dips.
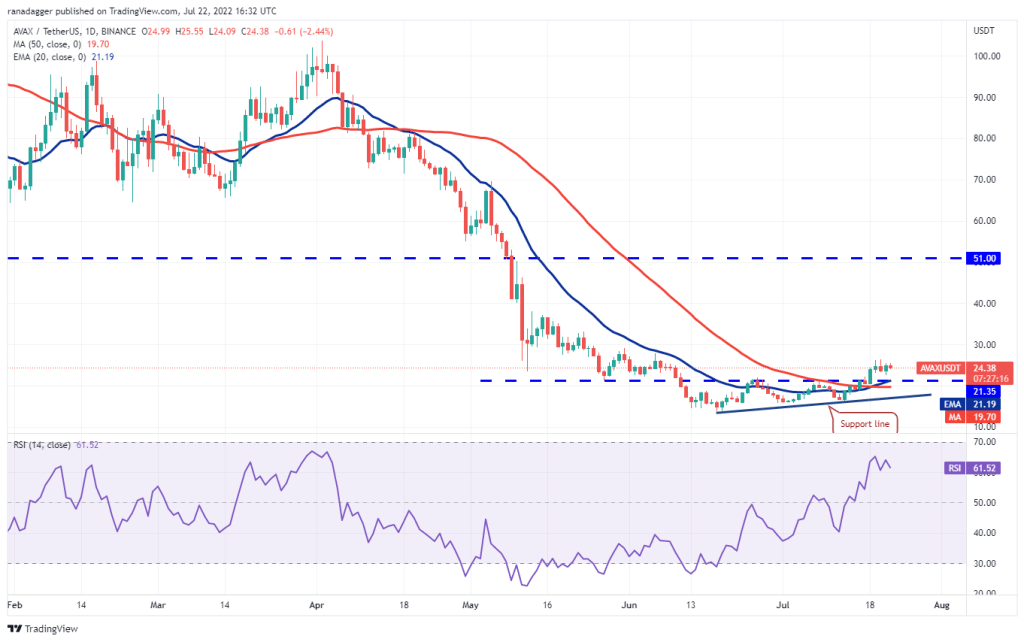
The ascending 20-day EMA ($21.19) and the RSI in the positive zone point to an advantage for buyers. If the bulls propel the price above $26.50, bullish momentum is likely to increase. It is possible for AVAX to rise to $29 and then to $33 later. Sellers will need to push the price below $21.35 for this bullish view to be invalidated. If they do, AVAX is likely to slip into the support line, which could attract buyers. A break and close below this level is likely to show that the bears are back in control.