
Fundamental analysis is said to tell you the story, while technical analysis signals when to enter and exit a trade. Technical analysis will help you see the direction of the current trend and when the market is overbought or oversold. Williams %R is a tool that helps traders identify trend direction and let them know when to buy or sell. In this article, we will learn about this relatively unknown indicator and four strategies for trading with it.
What is Williams %R Indicator?
Williams %R is a momentum indicator used in technical analysis that measures whether a crypto asset is overbought or oversold and about to start a new rally.
Williams %R, also referred to as %R or Williams Percent Range, was developed by Larry Williams and was first published in 1979. “How I Made A Million Dollars… Last Year… Trading Commodities” introduced in the book. In 1973 the United States officially removed itself from the gold standard and inflation was high and rising. As a result, many commodities have experienced strong trends similar to the cryptocurrency trends we are witnessing today.
When a market is experiencing strong trends, you want to use momentum indicators and tools to help you identify trading opportunities. Williams %R is a momentum indicator that generates easy-to-follow trading signals that allow traders to time their entry and exit.
Williams %R Formula
The %R formula uses this calculation:
Williams% R = (period high – closing price) / (high price – period low) x -100
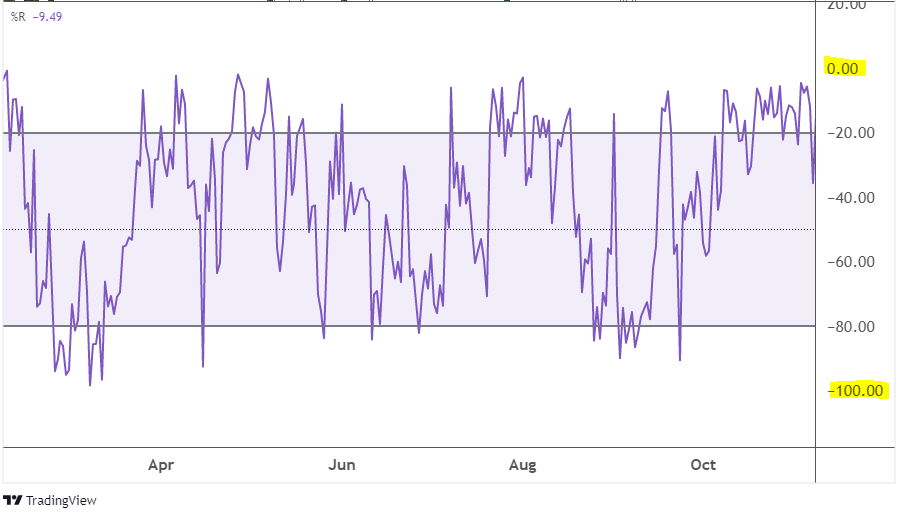
Basically, the calculation determines how close the current price is to the recent high or low. For example, a reading of -10 indicates that the asset is within the first 10% of the range. On the other hand, a reading of -90 indicates that the asset is in the bottom 10% of the range.
%R is a limited oscillator. This means that (in this case) the output values cannot be greater than zero or less than -100. Limited oscillators are excellent tools for providing trader signals of overbought or oversold assets as the signals are easy to read.
With the Williams %R, a reading above -20 is considered overbought. If a cryptocurrency breaks above -20, then it is nearing its recent highs and a correction may be needed.
On the other hand, a reading below -80 is considered oversold, suggesting that a bullish reversal is likely soon as the market is heavily oversold.
Pros and Cons of Williams %R
Like other technical indicators, Williams %R has both advantages and limitations.
First, as a limited oscillator, Williams %R makes the overbought and oversold signals very simple to read: -20 represents overbought and −80 represents oversold. No additional mathematical calculations are required to interpret whether a crypto-asset is overbought or oversold.
The biggest limitation of a limited oscillator is that markets can stay overbought or oversold for long periods of time. For example, if the Williams %R fluctuates between -0.05 and 0, it simply means that the market is trading near its high for the defined lookback period.
In other words, if the market is in a strong uptrend, it may experience %R readings in the overbought zone for an extended period of time, whereas for downtrends the situation is the opposite.
Another limitation for Williams %R is the scale it uses. I believe the %R was created with uptrends in mind and is therefore intended to be used to determine how close the market is to the high range. Thus, the market will always be one percent off the high, so Larry Williams multiplies the ratio by -100.
However, the scale is counterintuitive as you read it. As humans, we easily understand uptrends and positive numbers. Negative numbers require more mental capital to understand. Therefore, with almost all readings of Williams %R in negative territory, it takes more energy for us to interpret the numbers.
How to Trade Using Williams %R
Williams %R is a versatile oscillator and provides many uses. It has several patterns that provide efficient trading signals. Below, we will share four strategies that a crypto trader can use with the Williams %R indicator.
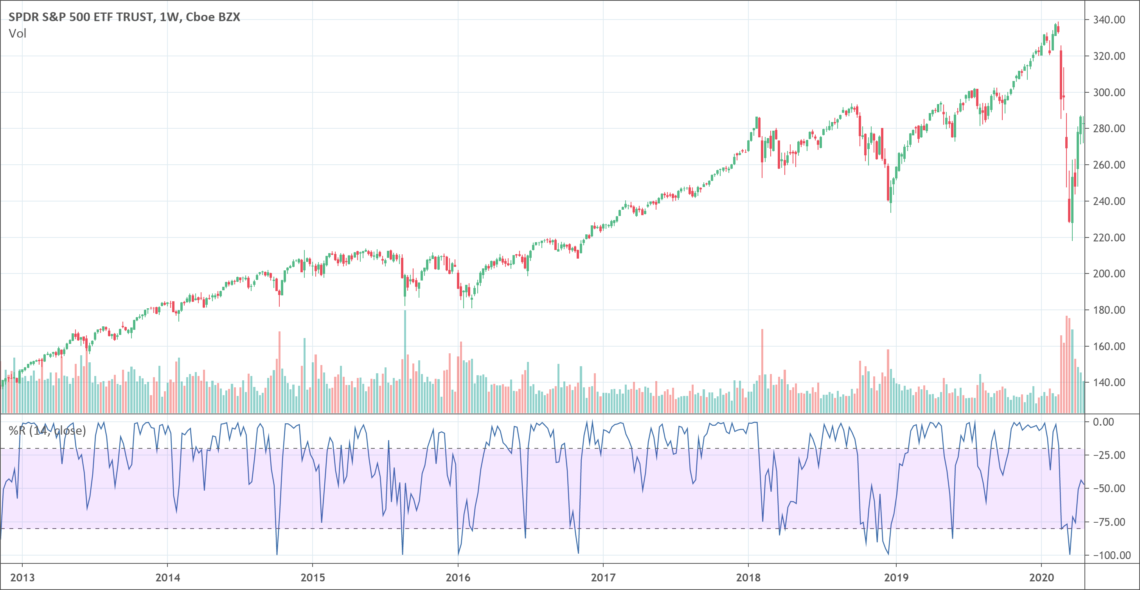
One of the advantages of Williams %R is the clearly defined overbought and oversold levels.
When an asset is oversold and below -80, a trader can buy when the market goes above -80 again. In overbought conditions, a crypto trader can wait to sell until the crypto market drops below -20. The chart above is illustrated with green vertical lines representing buy signals and red vertical lines representing sell signals.
We can add another layer to this simple strategy by filtering trades only in line with a trend. The point of this refined strategy is to ignore countertrend signals, while leveraging only signals that are aligned with the direction of the larger trend.
Above, we removed short signals by filtering out only buy signals while Bitcoin trend is up. When Williams %R falls below -80 into the oversold zone, notice a rally right after.
To summarize this strategy, a trader will buy in an uptrend when R% rises above -80, ignoring all short signals. In a downtrend, the trader will short-circuit when the %R falls below -20 while ignoring all long signals.
Midline as Trend Filter
Another way to use %R is to focus on the midline at -50.
We marked the middle of the oscillator with a dotted line at -50. When Williams %R rises above this midline, it indicates that the trend is up and may continue to rise.
On the contrary, when the %R line is below the -50 midline, it indicates a weak market that could weaken further.
Obviously, the %R line will swing back and forth between the bullish and bearish zone. But generally speaking, it stays within a region for a while. Therefore, a trader may try to initiate a position when the indicator line crosses -50 in either direction.
Bullish and Bearish Oscillator Divergence
There are times when the oscillator will act independently of price action, making a difference. When you notice this, it signals that a trend change is likely to occur soon.
For example, on the 2-hour chart of Bitcoin, the price is trading higher between September 13-21. After a brief correction that began on Sept. 21, Bitcoin is rallying again to reach a new high.
However, the %R oscillator does not rise to a new high. This divergence, with the oscillator not confirming the new high in price, is a bearish signal that a correction may be imminent. In fact, within a few hours, Bitcoin dropped 20%.
The opposite can also occur with bullish divergence.
This 4-hour Bitcoin chart from April 2021 shows an example of a bullish divergence. Bitcoin’s price drops to its first low on April 23. The Williams %R oscillator was oversold and Bitcoin rose a small amount.
Then, Bitcoin corrects lower again to hit a new low. However, the %R oscillator does not – which creates a bullish divergence. Bitcoin continues to increase by 30% over the next few days.
Williams %R Failure Swing Strategy
There are times when the market is so strong that corrections are very shallow and not prone to oversold. You want to be well positioned in these strong markets. The fail-release strategy can help.
In the Bitcoin daily chart above, you can see the Williams %R line attempting to correct the decline. However, the market is so strong that the %R line barely falls below -50 and does not reach the -80 oversold zone.
This is a bullish fail swing because the low swing is not reaching the oversold levels. If you spot situations like this on a chart, look for opportunities to position yourself on the long side.
With the benefit of looking back, we can see that Bitcoin has increased nearly 3x over the next four months as a result of this bullish energy.
Williams %R and Alternative Trading Indicators
As a limited oscillator, there are some similarities between Williams %R and other oscillators. It’s important to understand the similarities and differences between these oscillators so you can determine which one will work best for you.
Williams %R – Fast Stochastic Oscillator
Williams %R calculates the current level of the market based on the highest level for the review period. On the other hand, the fast stochastic oscillator moving between 0 and 100 compares the current level of the market with the lowest. All in all, these two oscillators basically do the same thing and look very similar on charts.
When you examine these two formulas, you will see that they look very similar with two key differences. The first difference we discussed earlier is that %R compares using the last highs, while fast stochastic compares using the last lows.
The second main difference is the multiplier. Because of this inconsistency, %R has a limited output range from 0 to -100 while the fast stochastic oscillator has a range of 0 to +100.
Williams %R and Relative Strength Index
Another limited oscillator is the Relative Strength Index (RSI) indicator. Like the fast stochastic, the RSI indicator measures between 0 and 100. But the similarities end there.
RSI calculation, “ above“your days” low ” includes the average against the days. In essence, it finds how strongly the crypto market recovers on bullish days and weak corrections on bearish days. The RSI is used to calculate how much a market moves on average.
Notice the difference with the %R, which is a pure price comparison with a high or low range. Williams %R calculates how close the current price is to the high and low range.
As a result, you will tend to get completely different values when comparing the RSI with the Williams %R.
In the Williams %R in the example above, oversold readings below -80 are easy to reach. However, the corresponding RSI readings never reach the oversold 30 level. Since Bitcoin was in an uptrend at the time, its relative strength is evident on the RSI oscillator with correspondingly high readings.
Final Words
The Williams %R tool is great for helping traders clearly identify overbought and oversold levels for cryptocurrencies. %R is also versatile because it is a simple tool that a trader can apply when using the oscillator. “buy the drops”There are four different strategies, from oscillation to oscillation errors.
While the %R scaling is not the most intuitive, traders working with stochastic or RSI oscillators will be familiar with how to use Williams %R as an indicator of overbought and oversold markets.