
While Bitcoin (BTC) climbed to $24,000, the market’s total value exceeded $1.1 trillion. Some analysts interpret this sudden acceleration as a sign of a major bull trap.
Capo warns Bitcoin investors against pitfalls
The Fed recently released updated interest rates that were increased by 75 basis points. This put a lot of pressure on the entire crypto market. A popular analyst, who has been waiting for a drop in Bitcoin price for quite some time, warns again, calling Bitcoin the ‘biggest bull trap’ of the year. Capo said on Twitter yesterday:
This is one of the biggest bull traps of the year, but you won't see it until it's too late.
— il Capo Of Crypto (@CryptoCapo_) July 28, 2022
On the other hand, Bitcoin performed a series of tests for $24,000 today. It is currently consolidating to surpass $24,294.79, where it briefly traded today. FXStreet analyst Akash Girimath analyzes what the leading crypto needs to do this.
Bitcoin needs to break one more level
Bitcoin lost 45% in a short time after surging to $32,375 on May 31. This move ended with the ATL of the year at $17,592. Many investors encouraged to buy BTC at a discount. Since then, Bitcoin and the broader market have been trying to recover. But using the Fibonacci retracement tool shows that the midpoint of this drop is $25,000.
Many traders saw the double formation at $19,239 on July 3-13 as a discounted BTC price. The result of this pattern was a 29% rally that broke the 200 four-hour SMA at $21,116, the 30-day EMA at $22,245 and the 200-week SMA at $22,710.
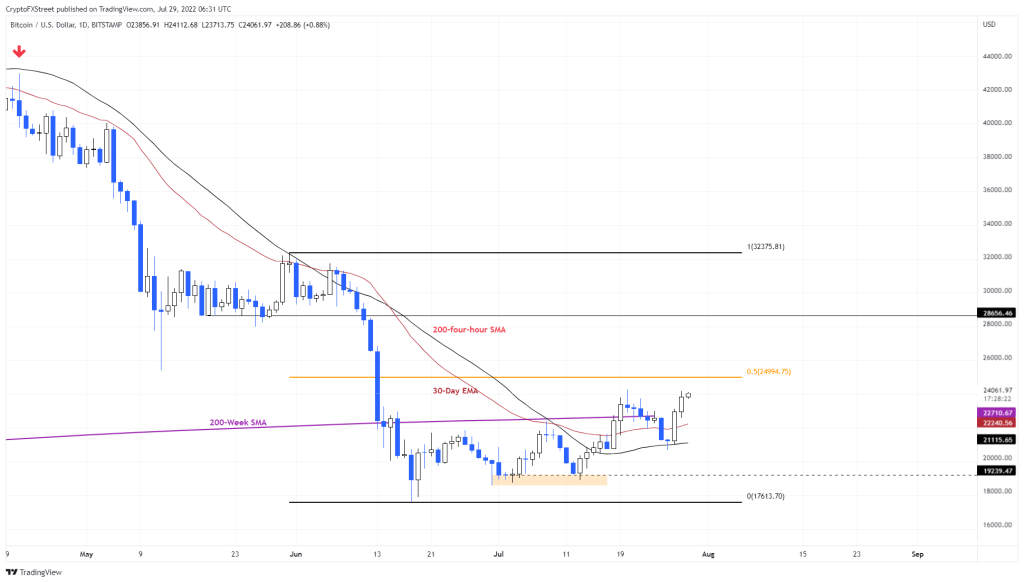
If this trend continues, Bitcoin’s next target will be $25,000. Judging by the consolidation between May 13 and June 11, $28,656 will be the next level of resistance that BTC will face if it breaks the $25,000 resistance. Hence, according to the analyst, the Bitcoin price could rise between 4% and 19% in the coming weeks. However, it is necessary to consider the opposite possibilities.
3 factors to suggest the negative trend continues
According to analyst Akash Girimath, BTC’s $22,710 support will be the first downside sign. Watching the weekly close will provide a much better outlook on this. Also, a break of the 30-day EMA at $22,245 will indicate that the daily trend is collapsing as well, acting as a tailwind for bearish pressure.
The final nail in the coffin would be a daily candlestick near the 200 four-hour SMA at $21,115. If these conditions are met, investors should be careful and avoid taking big risks. Beyond the $21,115 resistance, there is a huge but stable support area stretching from 20,000 to 19,000. This level is the highest traded level of 2022, that is, the checkpoint. It is also a breakout point for Bitcoin price as it is formed from the weekly support level of $19,000.
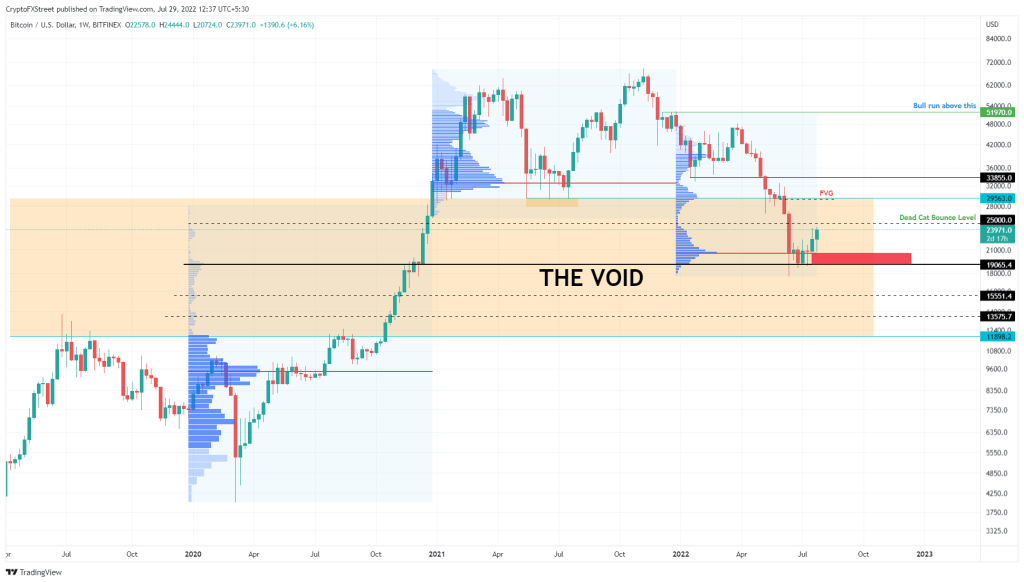
Therefore, the breakout of this support area is not only important for the bulls. It will also cause problems for investors who bought BTC at $17,000. The analyst expects this scenario to end at $11,898. Technical analysis of Michaël van de Poppe, Justin Bennett and 5 crypto experts cryptocoin.comas cited in this article.