The signs of softening in the aggressive policy of the Federal Reserve allowed the gold market to breathe. The gold market gained fresh momentum last week after three months of sharp declines. Market analyst Ross J Burland says gold bulls are again watching north of $1,800 for this week. Accordingly, the price is likely to see a correction in the meantime, but the techniques are in favor of the bulls. We have prepared Ross J Burland’s technical analysis for our readers.
“Gold benefits from lower interest rates and softer dollar”
A new week, a new month and the bulls remain in control for the open. cryptocoin.com As you follow, gold closed Friday with 0.58% increase. Thus, it increased its gains for the third consecutive session. It is also on track to recoup the $1,800 losses it lost at the beginning of July.
The contraction of the US economy for the second consecutive quarter pointed to a recession. This led to a decline in interest rates and a weakening of the dollar. The precious metal benefits from a lower interest rate environment and a softer US dollar. For those looking for a safe-haven asset alongside the dollar, the precious metal seizes this opportunity.
Gold technical analysis: Bulls enter critical recovery area
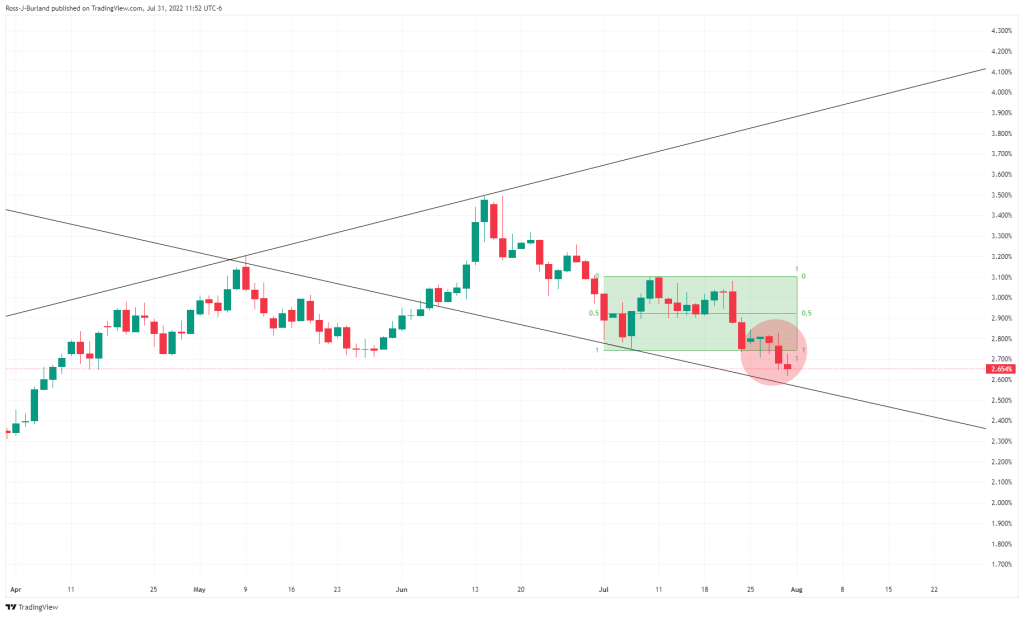
In the latest analysis, the 10-year rate cap for the lower bounds of the widening formation of the daily chart is considered to be in the background for US bonds.
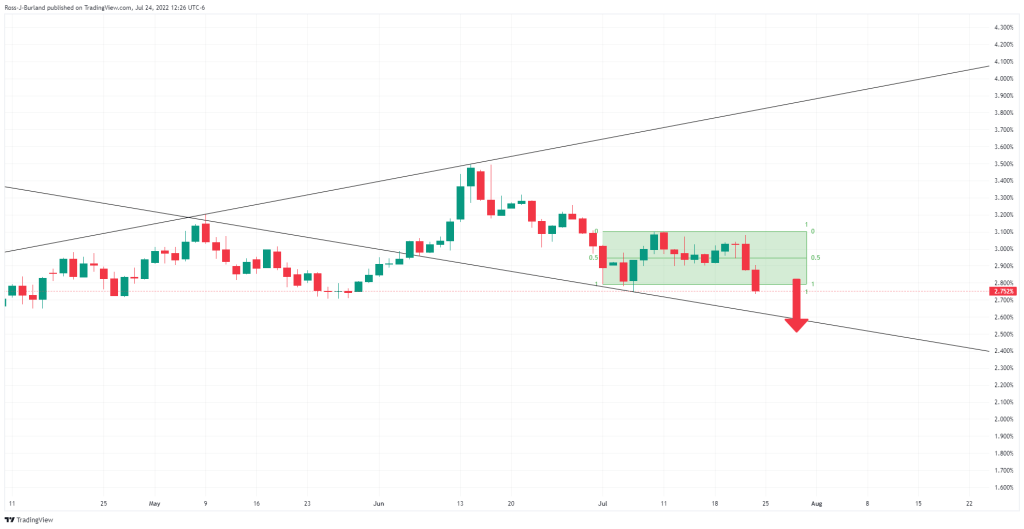
The broadening formation looks compelling, providing more room to the downside that could be expected to support gold prices.
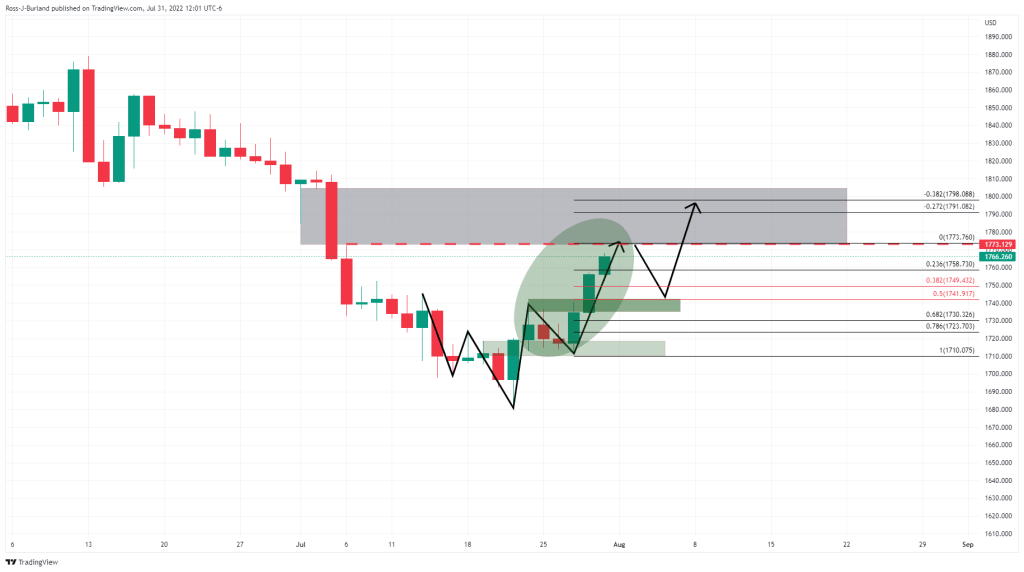
With this game, the golden bulls had a clear rise towards the end of July. Also, the daily chart’s W pattern highlighted in last week’s opening has wrapped up on the way to reduce price volatility (grey area) as follows:
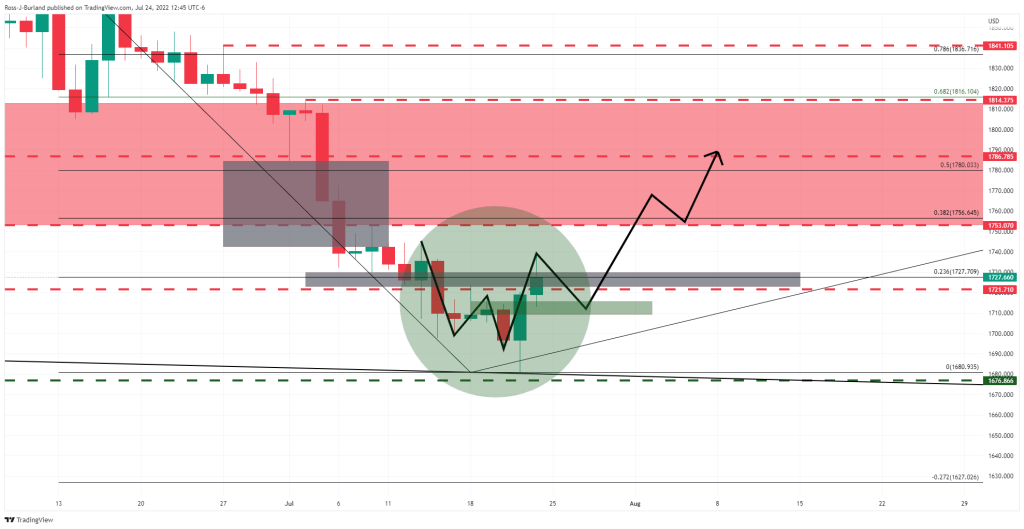
Meanwhile, for the opening, it is possible to take profits before the next potential rally in an attempt to reduce the price imbalance between $1,772 and $1,804. In addition, a price movement that results in a pullback is possible. This way we are likely to see some reflection from traders and investors.
Meanwhile, there is a confluence between previous highs and the assumed support structure between the 38.2% Fibonacci and 50% average reversal area around $1,750.
“Need to close north of $1,785 for trend change”
Evaluating the impact of the developments in the market on the gold market, TD Securities analysts make the following comment:
A short-term rally occurred in the global markets. As this continued, the probability of a gold CTA buying program increased. However, prices still need to close north of the $1,785 level to trigger a change in trend signals.