One trader and analyst says Bitcoin (BTC) could hit $30,000 if it continues to make current daily higher highs and lows as the market avoids weekend losses.
Bitcoin predictions from Material Indicators
TradingView data showed BTC climbing overnight, once again near the top of its established trading range. cryptocoin.com As you follow, Bitcoin has made multiple unsuccessful attempts to break above the range resistance at $23,500. After that, BTC still appears to be in limbo at the time of writing. However, the hopes that the uptrend would continue were already there, according to analysts.

On-chain tracking resource Material Indicators shared some updates for Bitcoin on Twitter on Aug. “We expect more volatility in the week,” he wrote in some of them. In this context, Material Indicators makes the following evaluation:
If the bear market rally can push BTC above 25k, there won’t be much friction in the $26,000-$28k range. Losing the trendline would be bad for bullish hopes and dreams.
For Bitcoin, $28,000 is 20% higher than the current spot price. It will also represent a two-month high. Material Indicators features a chart showing the trendline at $22,000, which is around the current realized price of Bitcoin. The chart also shows that bid support is increasing just below the spot. However, the main resistance remains at $24,500.
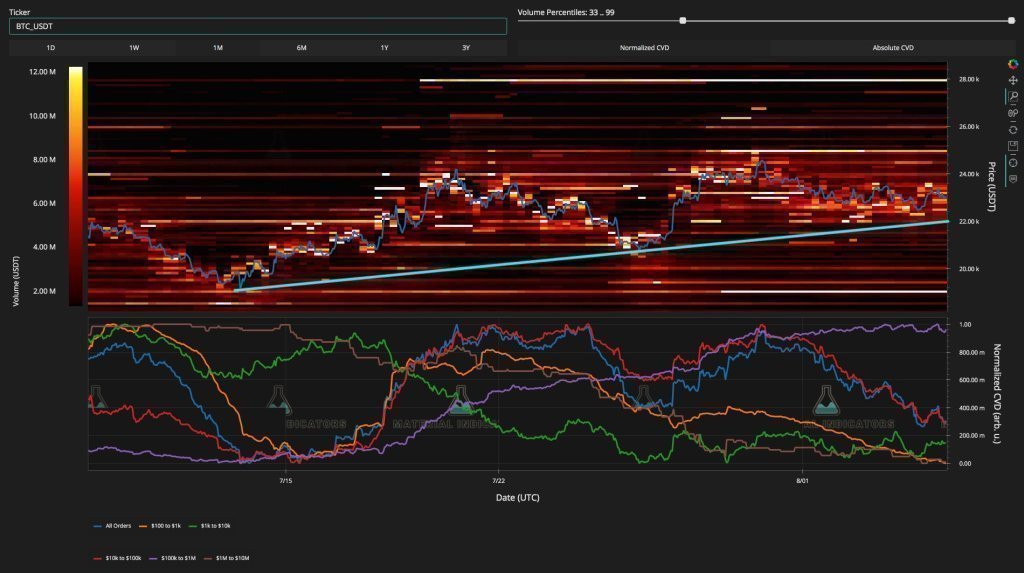 BTC buying and selling levels with trendline / Source: Material Indicators
Analyst gives $30,000 target for Bitcoin
In weekend trading, institutions and professionals prefer to stay away until the new trading week. Therefore, individual traders dominate the market. Therefore, exchanges traditionally lead to more volatile price movements, owing to the lack of liquidity in their order books.
Meanwhile, while analyzing the daily chart, the popular trading account CROW is entertaining even higher levels. He notes that Bitcoin continues to make higher highs and higher lows. That’s why he only reveals his plans to profit from $30,000.
$BTC
Keeping it simpleThe market structure is bullish, and I'll stay bullish as long as we're making Higher Lows and Higher Highs.
$30k is my main area of interest to take profit.#Bitcoin pic.twitter.com/LGGyW5whB4
— CROW (@TheCrowtrades) August 6, 2022
“The weekend is all about range trading due to fake exits,” adds trader Crypto Tony. In this context, the analyst says:
I like to set ranges and play accordingly. Ranges are effective in identifying true exits or fake exits. You can play both.
Monthly RSI hints that BTC price reversal has begun
PlanB, the creator of the Stock-to-Flow family of Bitcoin price models, also shared his predictions. By looking at cross-chain data, the analyst is again marking the rise of relative strength index (RSI) performance. The RSI is a key metric that shows how much BTC is comparatively overbought or oversold at a given price. Meanwhile, this metric hit its lowest levels ever in June. PlanB suggests that the now rebounding RSI may even signal the end of the 2022 bear market.
#bitcoin Relative Strength Index (RSI) bounced back in June. Bear market over? pic.twitter.com/hsb6S6aW0n
— PlanB (@100trillionUSD) August 6, 2022
Meanwhile, in a previous post on Aug. 3, PlanB acknowledges that BTC is still ‘well below’ its stock-to-flow daily forecast. That’s $83,475 for August 6, according to automatic calculator S2F Multiple.