
The S&P 500 ended its four-week recovery last week after minutes from the Fed’s July meeting hinted that the central bank would continue to raise interest rates until inflation is under control. Fed members said there was no evidence that inflation pressures were easing. Weakening sentiment pulled the S&P 500 down 1.29% for the week. Bitcoin (BTC), which maintains its close relationship with the S&P 500, also experienced a sharp decline on August 19. So, will the bulls use the dips to accumulate lower? Analyst Rakesh Upadhyay shared his analysis of four altcoins and BTC to follow. Here are the details…
What’s next for Bitcoin?
Bitcoin broke below the 20-day exponential moving average (EMA) of $22,864 on August 17. It then fell below the 50-day simple moving average (SMA) of $22,318 on August 19. According to analyst Upadhyay, the bulls are trying to stop the decline at support, parallel to the ascending channel line. The 20-day EMA has started to drop and the relative strength index (RSI) is in negative territory. This shows an advantage for the bears. If the price changes direction from the moving averages, it indicates that the bears are selling on the rallies.
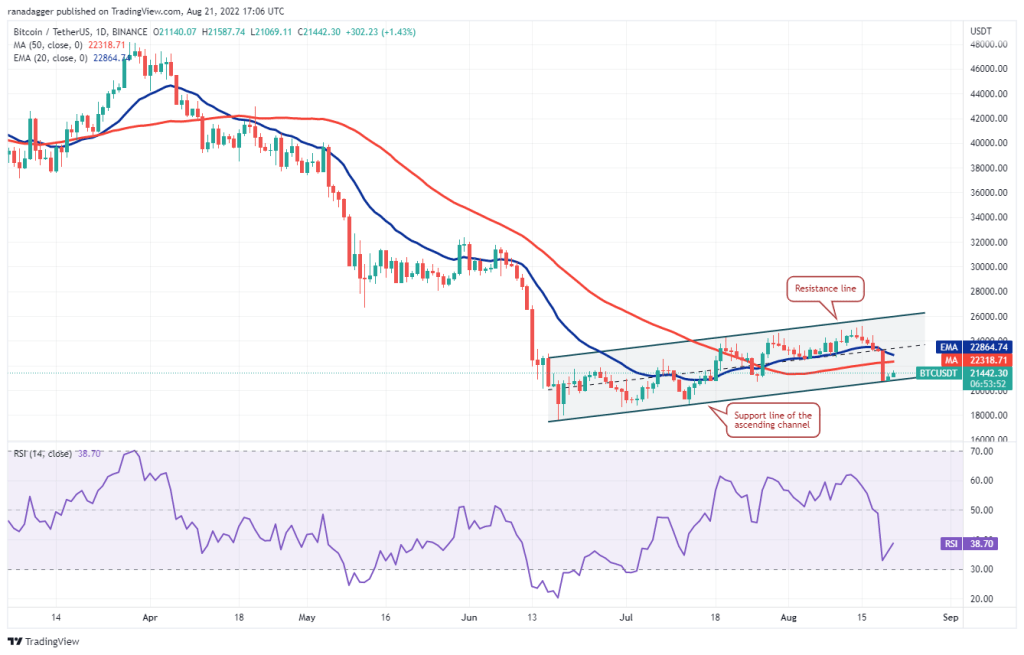
This could increase the likelihood of a break below the support line of the channel. If this happens, the critical support zone between $18,626 and $17,622 could be attacked. To avoid this situation, the bulls will need to push the price above the moving averages. The expert thinks that if they do, we will see the BTC/Tether (USDT) pair rise towards the resistance line of the channel.
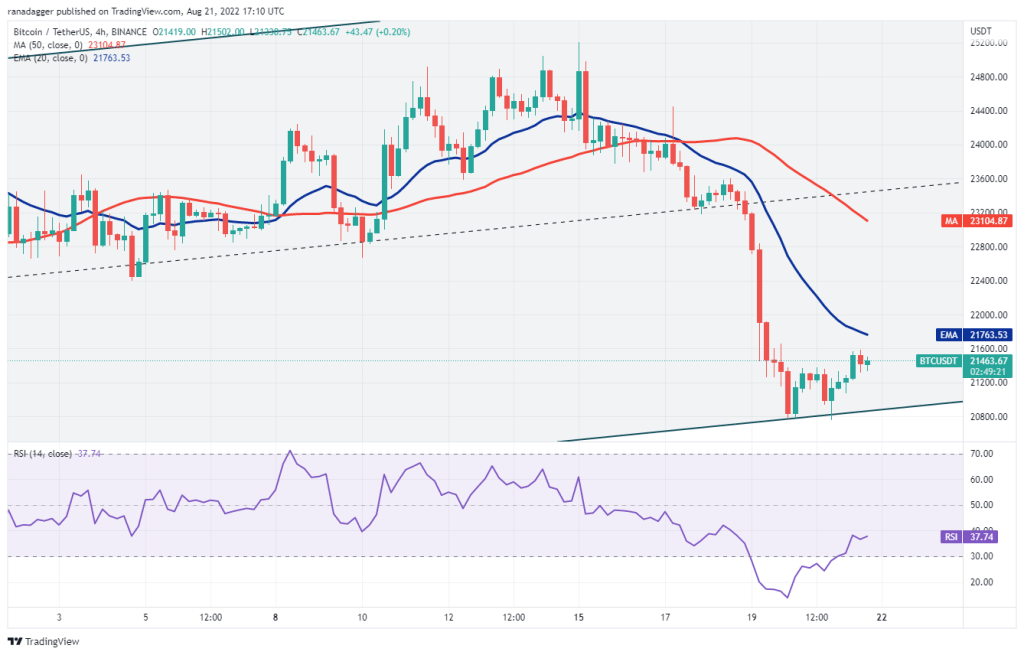
Buyers are aggressively defending the support line of the channel, but the descending moving averages and RSI in negative territory suggest that higher levels could attract selling by the bears. If the price breaks from the current level or the 20-EMA, the probability of a break below the channel increases. If this happens, the bearish momentum could increase and the pair could drop to $18,626. The first sign of strength would be a break above the 20-EMA. Such a move will indicate that the selling pressure may drop. This could increase the probability of a rally to the 50-SMA.
Broad price range for Binance’s altcoin project BNB
cryptocoin.com As we have also reported, Binance Coin (BNB), the altcoin project of the Binance exchange, fell from the general resistance at $ 338. However, the bulls successfully defended the strong support at $275. This signals a positive sentiment as the bulls see the dips as a buying opportunity. The recovery may face resistance at the 20-day EMA at $301. If the price drops from this level, the bears will again try to push the BNB/USDT pair below $275. If this happens, the pair is likely to oscillate in a wide range between $183-338 for a while.

Conversely, if the bulls push the price above the 20-day EMA, the pair could rally to $338. A break and close above this level could complete a bullish head and shoulders pattern. This could start a rally to $413 and then to the $493 pattern target. The 20-EMA on the 4-hour chart has started to rise. On the other hand, the RSI is close to the midpoint, which indicates that selling pressure may decrease.
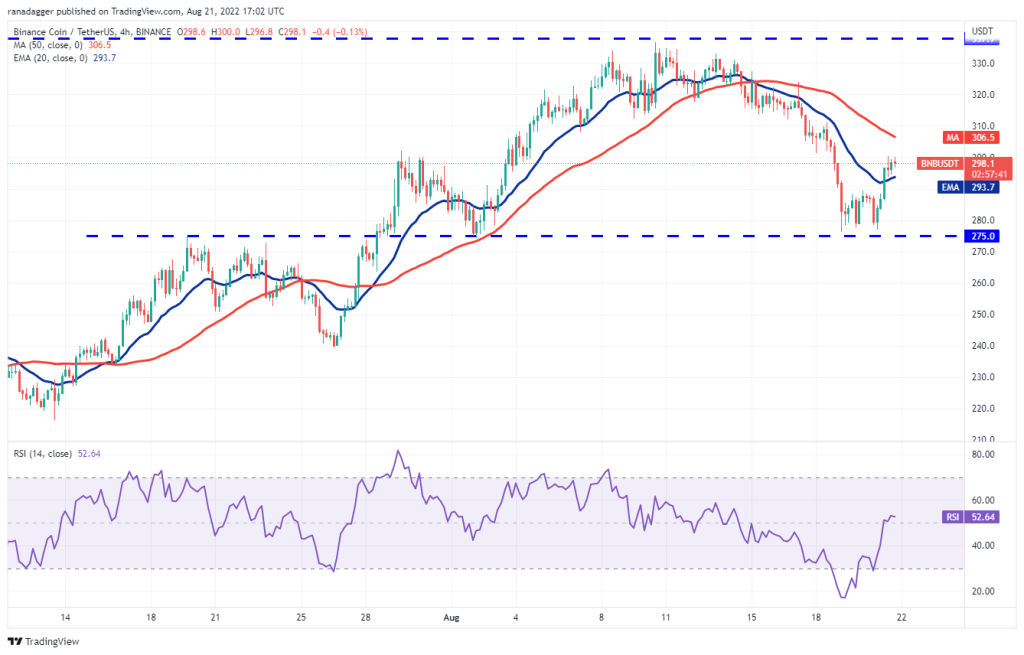
If the price continues above the 20-EMA, the pair could rally to the 50-SMA. A break and close above this resistance could increase the probability of a rally to $338. Conversely, if the price declines and breaks below the 20-EMA, the pair could drop back to the critical support at $275. “If this level is broken, the pair will complete a bearish head and shoulders pattern and drop to $240,” Upadhyay says.
What’s next for the popular altcoin EOS?
EOS created the upside inverse head and shoulders setup. Buyers pushed the price above the overhead resistance at $1.46 on August 17, but the long wick on the day’s candlestick indicates strong selling at higher levels. The bears pushed the price back below the $1.46 break on August 19. However, the positive sign was that buyers did not allow the EOS/USDT pair to stay below the 20-day EMA ($1.32). According to the analyst, this indicates that lower levels are attracting buyers.
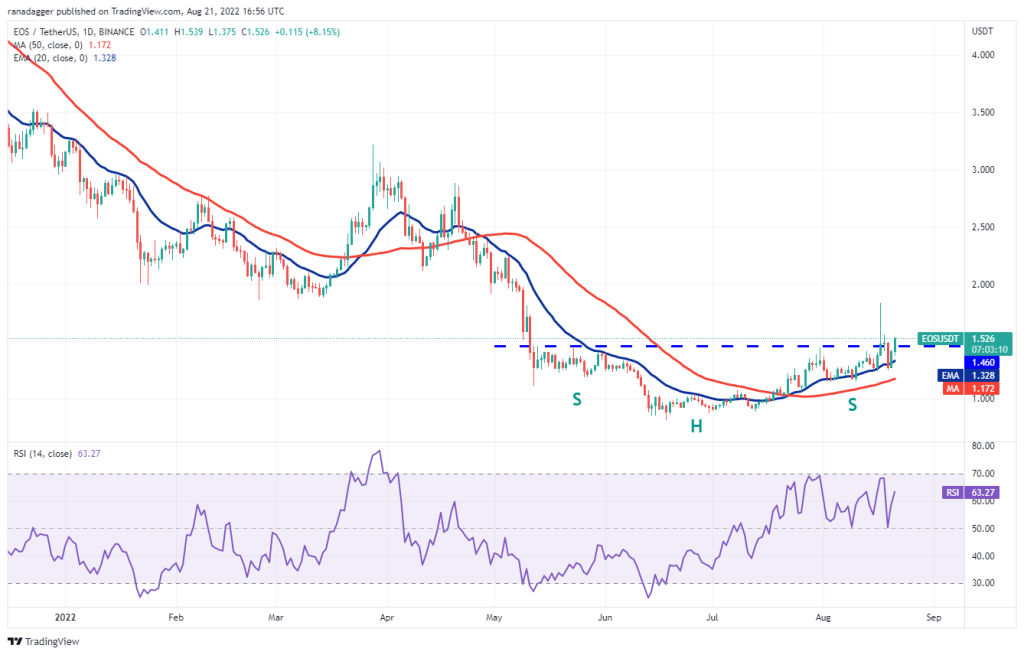
If the bulls hold the price above $1.46, the positive momentum could increase and the pair could rally to $1.83. If this resistance scales as well, the rally could extend to the $2.11 pattern target. This positive view could be invalidated if the price declines and drops below $1.24. The pair could later decline to the 50-day SMA ($1.17). The rally above $1.46 on August 17 pushed the RSI to overbought levels on the 4-hour chart.
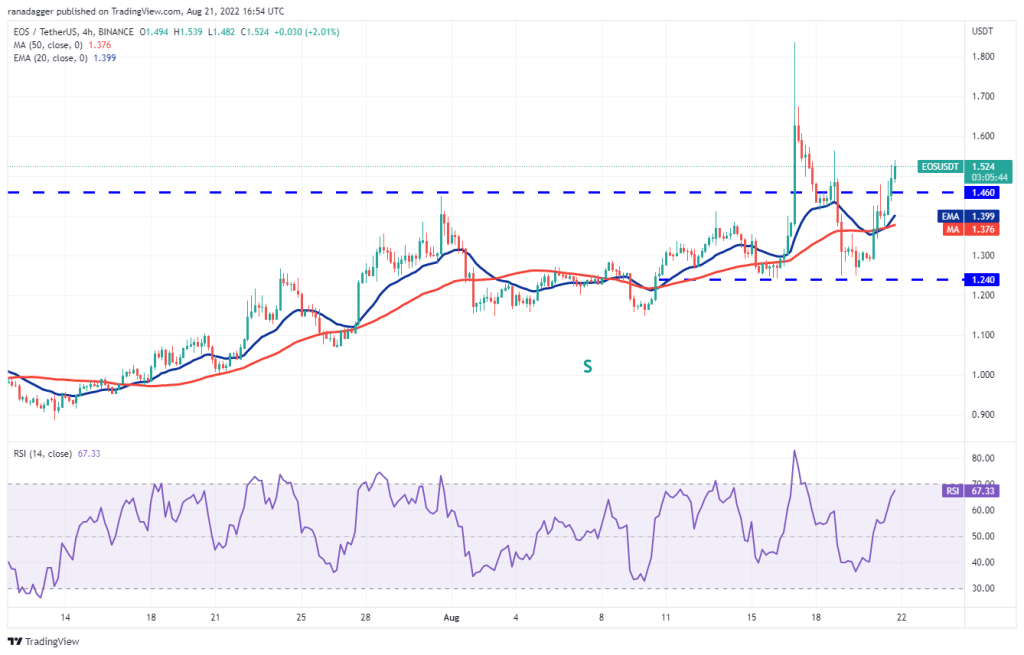
According to the analyst, this may have encouraged short-term buyers to book profits. The bulls bought this level on the decline and pushed the pair back above the overhead barrier at $1.46. The altcoin could now rally as high as $1.56 and then the key resistance at $1.83. Alternatively, if the price breaks below the current level and below the moving averages, it indicates that the pair may remain range-bound for a few days.
Is the fix process ending for Quant?
The series of higher highs and higher lows indicates that Quant (QNT) is in a short-term uptrend. The bulls bought the dip to the $100 50-day SMA and are attempting to continue the upward move. If the price stays above the $111 20-day EMA, it indicates that the correction may be over. The QNT/USDT pair may rise to $124 first. It could then retest the important resistance at $133. If the bulls break this hurdle, the pair could rally to the overhead resistance zone between $154 and $162.
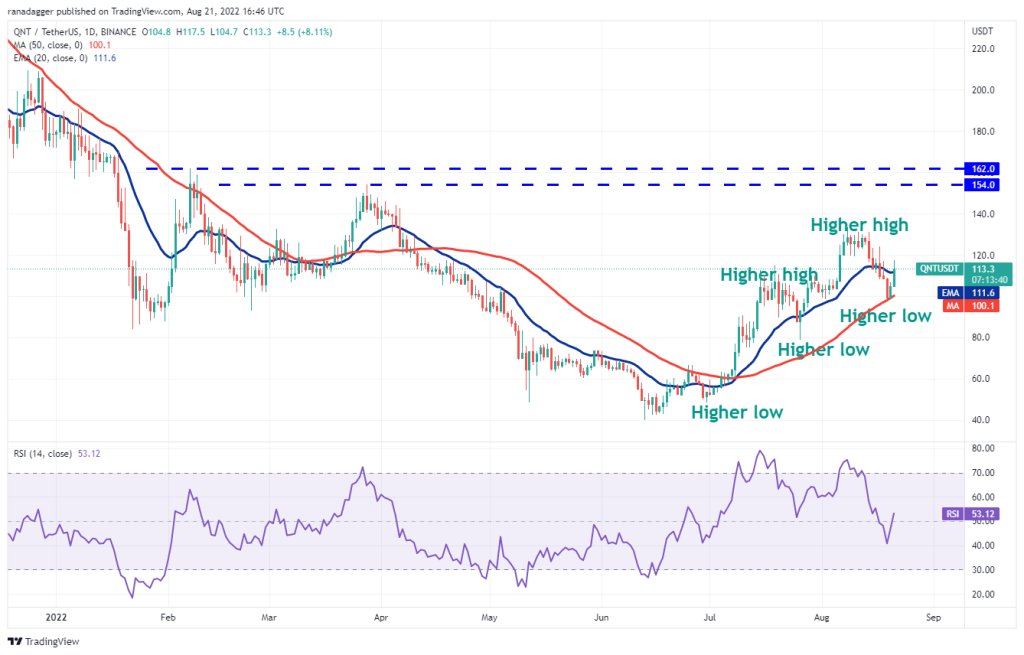
Contrary to this assumption, if the price fails to stay above the 20-day EMA, this will indicate that traders can close their positions in the rally. The bears will need to push the price below $98 to gain the upper hand and signal the start of a deeper correction to $79. According to the analyst, the pair is correcting within a falling wedge pattern. Buyers pushed the price above the resistance line of the pattern but failed to sustain the breakout. This indicates that the bears are active at higher levels.
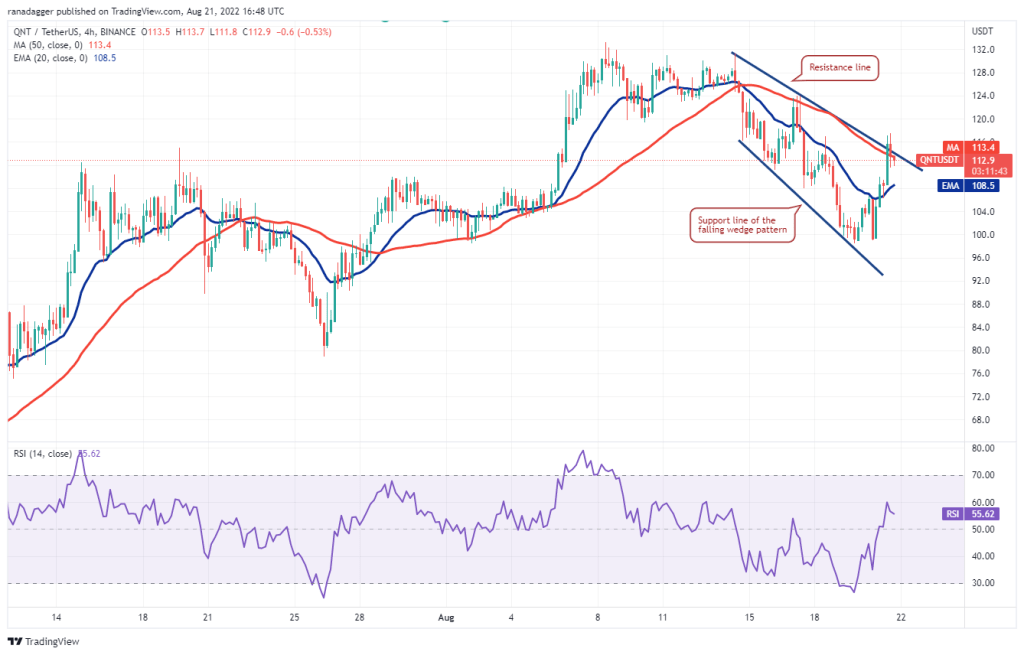
If the price stays below the 50-SMA, the pair could slide to the 20-EMA. This is an important level to be aware of. If the price rises above this level, it will indicate that the short-term trend is turning in favor of the buyers. A break and close above $118 could indicate that the correction phase may be over. Conversely, if the price breaks below the 20-EMA, the pair could drop to $100.
The last altcoin on the analyst’s list: Chiliz
Chiliz (CHZ) rose to $0.23 on August 18. This pushed the RSI into the overbought territory. This may have encouraged short-term investors to book profits. This, in turn, may have pushed the price back below the $0.20 breakout level. A minor positive move is when the bulls try to defend the 20-day EMA of $0.17 and push the price above $0.20. According to Upadhyay, if the bulls achieve this, it will show that the sentiment remains positive and traders are buying on the dips. This increases the probability of a retest of $0.23. If the bulls break this hurdle, the CHZ/USDT pair could gain momentum and rally to $0.26.
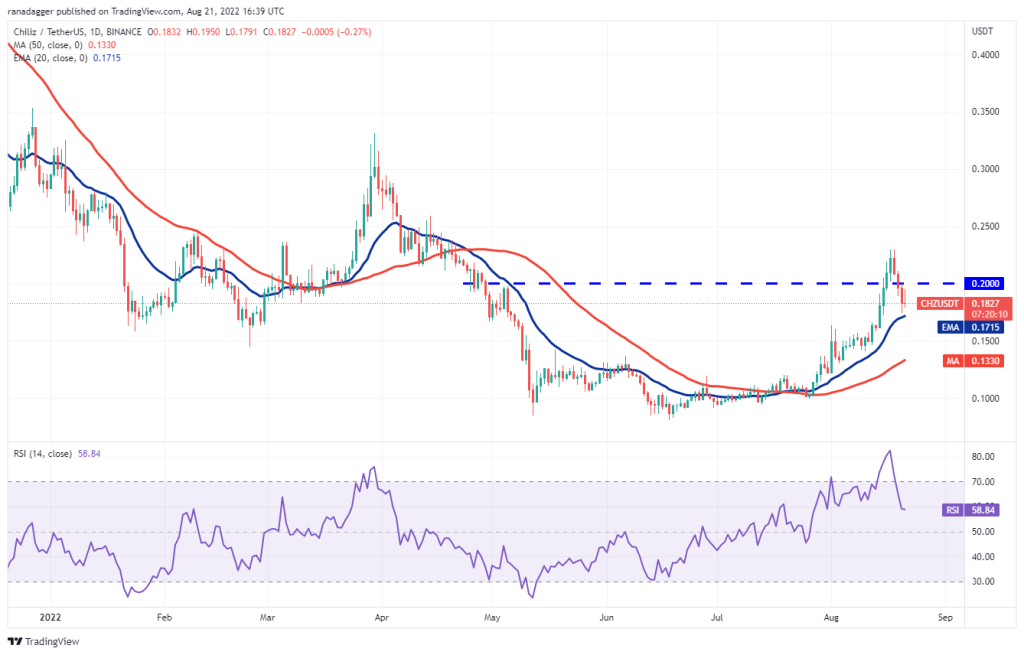
Contrary to this assumption, if the price fails to break above $0.20, it means that the bears are selling on rallies. If the pair sinks below the 20-day EMA, the bears will be back in the driver’s seat. The pair could then decline to the 50-day SMA of $0.13. The bulls are trying to defend the uptrend. However, the recovery is facing strong resistance in the moving averages. The moving averages have completed the bearish divergence on the 4-hour chart and the RSI is in negative territory, pointing to a minor advantage for the sellers.
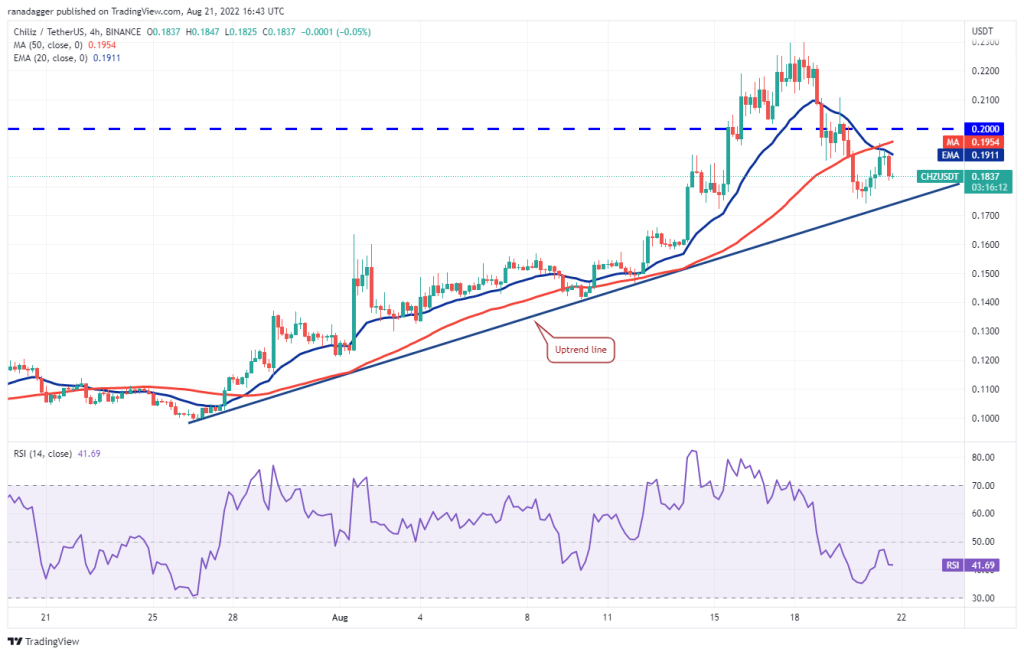
According to the analyst, if the price drops and dips below the bullish line, selling could intensify. The pair could decline to $0.16 and then $0.14. Such a move will show that the bears remain in control. Instead, if the price rises above the moving averages, the bulls will try to push the pair to $0.21 and then challenge the resistance at $0.23.