Crypto analyst Akash Girimath says that Bitcoin is advancing above a stable support level of $21,209. It is possible that an increase in selling pressure could lead to a steep correction to $20,000. On the other hand, a daily candlestick above the $25,000 psychological level will invalidate the bearish view. We have prepared Akash Girimath’s Bitcoin forecast and analysis for our readers.
Before Bitcoin attempts a recovery rally…
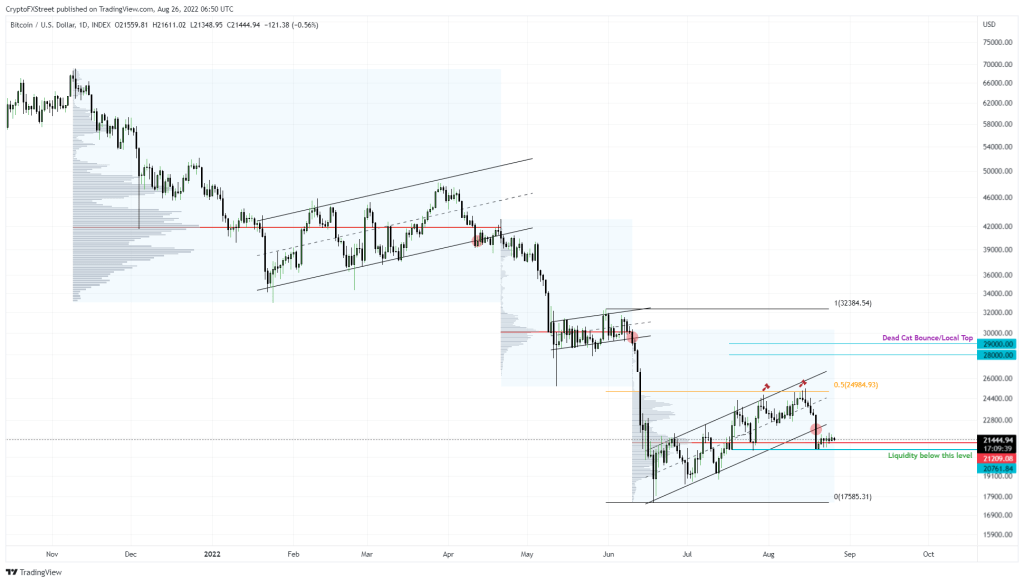
Bitcoin price clearly shows three parallel channels that have developed over the past eight months, all of which have led to a bearish trend. The most recent was on August 19, when BTC dropped 10% from around $23,200 to $20,800. As a result, Bitcoin has now created roughly three equal lows around $20,750. Despite this drop, BTC had positive success with $21,209 above the highest trading volume level, Point of Control (POC).
Liquidity below these volatility points is the main target of market makers at around $20,750. Therefore, they will likely push BTC down to sweep this level again before attempting a recovery rally. But before we jump to a conclusion, let’s look at a chart on a lower time frame.
 BTC 1-hour chart
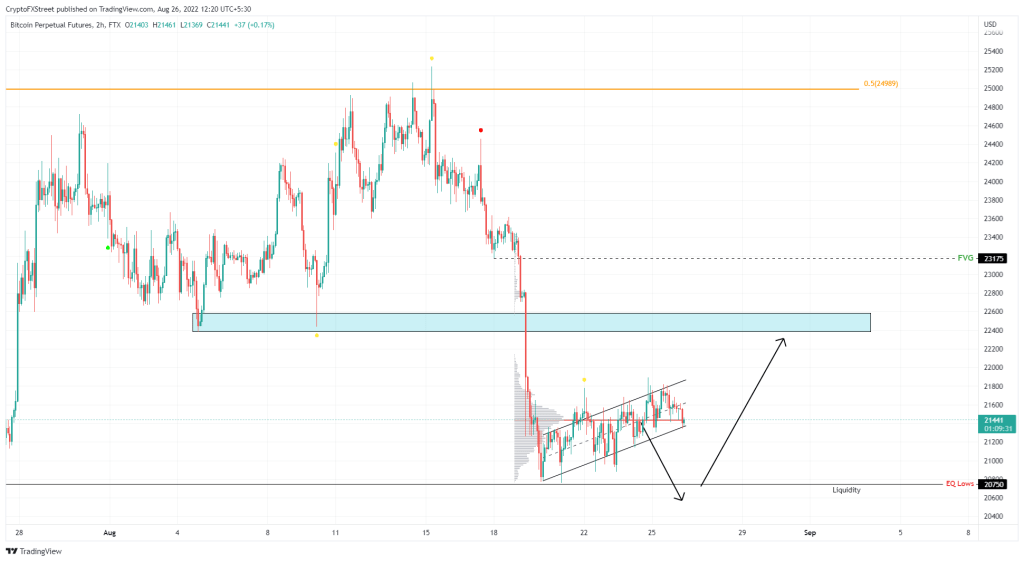
On the hourly chart, Bitcoin appears to be forming another ascending parallel channel. This one is very close to breaking. However, the peak volume between August 18 and August 22 is roughly $21,437. Also called Point of Control (POC), this level will act as a support level. A conversion of this foothold to a resistance barrier will confirm a lower time frame failure.
“Bear Bitcoin forecast makes sense to gather liquidity”
However, market participants need to be aware of the higher time frame POC of $21,209 which could simultaneously thwart the bears’ plans. Therefore, waiting for the secondary confirmation provided by a dump of $21,209 will add more confidence to the idea of a sell spree to $20,750.
 BTC 1-hour chart
To gather liquidity, the bearish Bitcoin forecast makes sense. However, this will likely never happen unless BTC breaks below the $21,209 support base. Instead, a bounce from this barrier is likely to prematurely trigger a recovery rally. In such a case, it is possible for market participants to encounter Bitcoin with a blockage of 22,382 to $22,586. Overcoming this hurdle will be relatively easy. This will push BTC to fill the imbalance at $23,175 and potentially create a local top.
Bitcoin forecast: An outline of the bullish outlook potential
If the recovery rally thesis described above continues to gain momentum, BTC is likely to retest the $24,989 hurdle, which is the midpoint of the 44% crash it witnessed between May 31 and June 18.

cryptocoin.com As you follow, BTC failed after three attempts in August. Therefore, this level was particularly difficult to overcome in the past. Therefore, a stable daily candle close that turns this barrier into a support base will be a strong indication of the presence of bulls and a resurgence of buyers. Such a development will invalidate the decline thesis. It will then pave the way for a recovery up to $29,000.
As seen on the one-day chart, the area between $28,000 and $29,000 is likely to face massive selling pressure from those who booked the relief rally. Therefore, it is possible for a local hill to form here.