This week was a red one for the crypto market, as with all risky markets. The hawkish statements in Fed Chairman Powell’s speech on Friday sparked the decline. So where will the decline end and what levels do we have ahead of us? Let’s take a look at the technical analysts of Cardano, DOT, ETH and SOL by Bob Mason to answer.
Cardano, DOT, ETH and SOL technical analysis
Cardano (ADA)
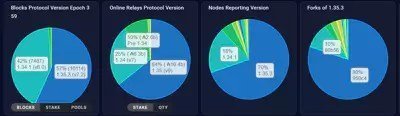
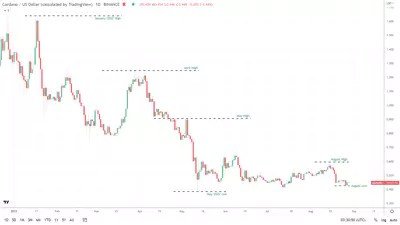
The ADA price fell 3.01% from Monday to Sunday morning at $0.4482. During the bearish week, the ADA price hit August lows. While Fed Chairman Powell did the damage, Cardano founder Charles Hoskinson was sharing hints about the Vasil hard fork. According to PoolTool, 70% of Cardano SPO node participants were upgraded to v1.35.3 from 68% on Saturday, 62% on Friday and 53% on Thursday.
On a trend basis, ADA will need to retrace the August high of $0.595 to target the May high of 0.906. However, a possible drop to this week’s August low to $0.425 will open May and the current year low to $0.384. Updates in the Vasil hard fork will continue to be the key driver.
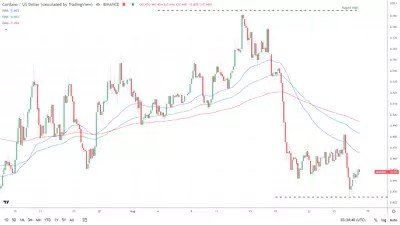
Looking at the EMAs on a 4-hour basis, this was a bearish signal. On Sunday, ADA settled below the 50-day EMA, currently at $0.465. Following the bearish trend of the 100-days EMA over the 200-days EMA, the 50-days EMA and the 100-days EMA have dropped from the 200-days EMA to give negative price signals.
The retracement of the 50-day EMA from the 200-day EMA gives the bears a glimpse of below $0.40 and 2022 lows ($0.384). However, an ADA breakout from the 50-day EMA ($0.465) will ease the selling pressure and bring $0.50 back into the spotlight.
Polkadot (DOT)
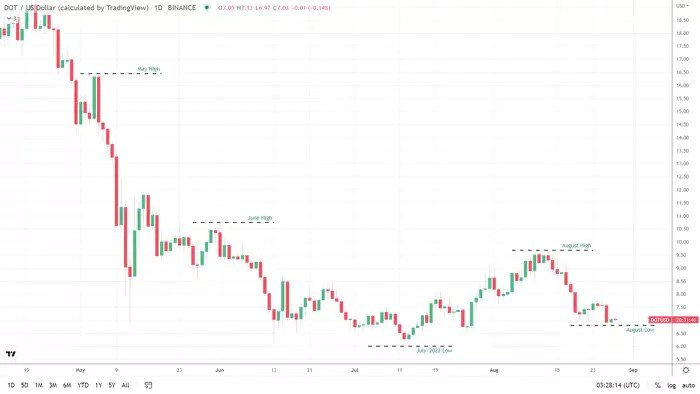
The DOT is down 5.38% this week to $7.03. Wednesday’s high hit $7.77 before hitting Saturday and August’s new low at $6.80. DOT, which found support by the end of the week, has returned to the levels of $ 7.0. While Fed Chairman Powell weighed in, investor sentiment towards Polkadot and news of new parachain were supportive.
Looking at the trends, a DOT move to the August high of $9.68 supports a run at $10.00 and the June high of $10.73. DOT bulls could start a clear rally from the $10.73 May high at $16.44.
However, the DOT will need to stay away from the August low of $6.80 to avoid a pullback to the current year low of $5.99. While the network updates will continue to impact, Fed monetary policy sentiment will remain a major focus as investors turn their attention to US economic indicators.
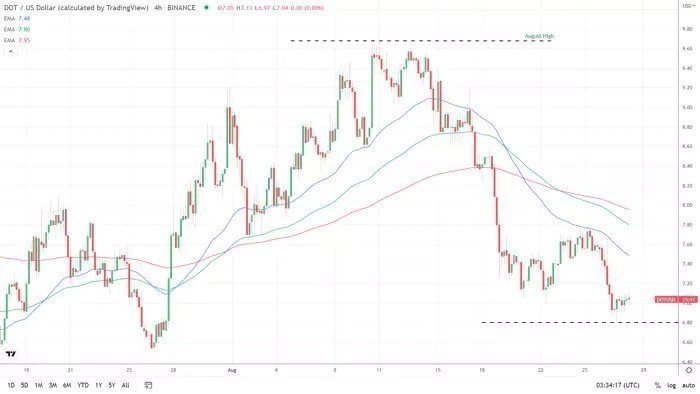
Looking at the EMAs on a 4-hour basis, the signal was bearish. The DOT has settled below the 50-day EMA, currently at $7.48. Following Tuesday’s downtrend, the 100-day EMA has dropped from the 200-day EMA. Later, the 50-day EMA regressed from the 200-day EMA. Further retracement of the 50-day EMA from the 200-day EMA will activate the current year low of $5.99.
However, a DOT move at the 200-day EMA and a return to $8.00 will signal a reversal of the short-term bearish trend and a run to the August high of $9.68.
Ethereum (ETH)
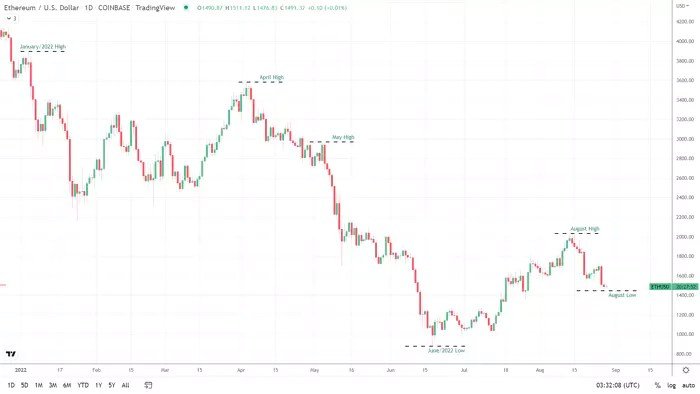
In the current week, from Monday to Sunday, ETH is down 7.82 percent to $1,491. ETH hit Thursday’s high of $1,722 before falling to Saturday and a new August low of $1,447. Updates on the Ethereum merge have been withdrawn as investors respond to US economic indicators and Fed Chairman Powell.
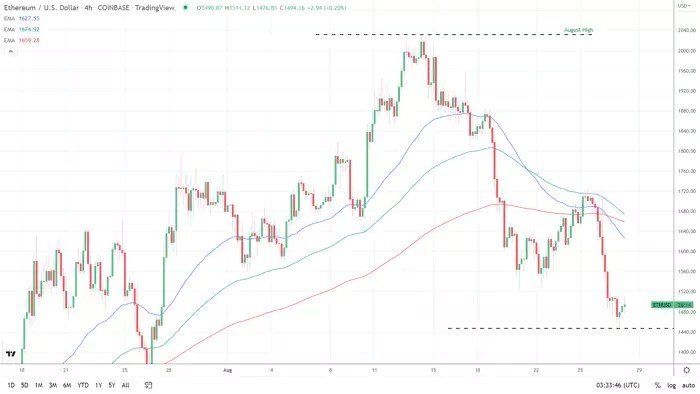
Looking at the EMAs on a 4-hour basis, this was a bearish signal. ETH is currently sitting below the 50-day EMA at $1,628. Following Friday’s downtrend, the 50-day EMA has dropped from the 200-day EMA. The 100-day EMA has narrowed to the 200-day EMA, both of which are negative in ETH price.
Left (LEFT)
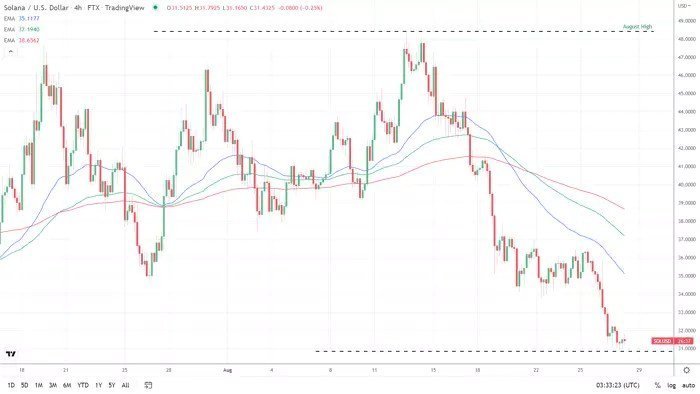
From Monday to Sunday morning, SOL was down 13.96% to $31.38. There hasn’t been a major network update that has left the SOL price in the hands of Fed Chairman Powell. Looking at the trends, a return to $50 will allow the bulls to run to the May high of $95.19. SOL will need ample support to break out of $75. However, the August low to $30.86 will provide an escape to the June lows at $25.78.
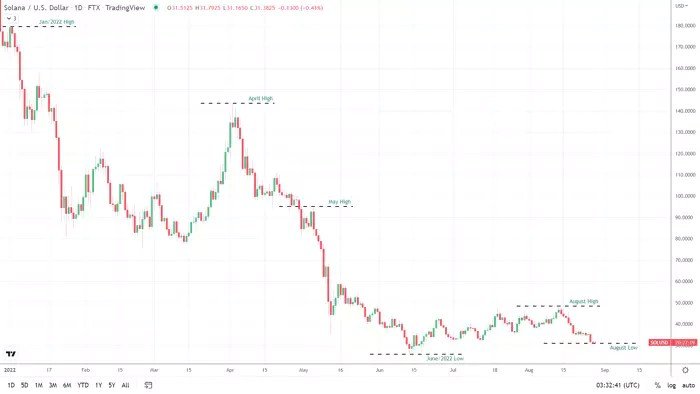
Looking at the EMAs on a 4-hour basis, this was a bearish signal. SOL is currently sitting below the 50-day EMA at $35.12. The 50-day EMA has retraced from the 200-day EMA. The 100-day EMA has retraced from the 200-day EMA, both price negative. Further pullback of the 50-day EMA from the 200-day EMA will support a drop below $30. Another week of bearish will bring June 14th to the current year low of $25.78.
However, a SOL move at the 50-day EMA (35.18) would favor a run at the 100-day EMA (37.19). In case of a move to $37.19, we could see a run to $20038.66 and $40.