Analyst Clem Chambers says charts are a great way to predict the past. From this point of view, the analyst explains the reasons for the prediction of 12 thousand dollars for Bitcoin. We have prepared Clem Chambers’ market assessments and BTC forecasts for our readers.
“It is possible to see the noise in the Bitcoin chart and the fractals in it”
I always say that graphs are a great way to predict the past. Surprisingly, this can make them very useful. They cannot predict the unpredictable, but the past greatly influences the future. Because signal and noise are intertwined. Also, once you can measure the underlying signal, it’s a guide to the next step. Perfect markets are random. But few are perfect these days of markets ‘curated’ by regulators, especially with liquidity gimmicks.
People just aren’t fooled by randomness. They are also often unaware of signaling. You may be moving at random, but you’re still in your car at roughly the same time and going to work at roughly the same place. The thrust of the day is not random, even if you randomly parked your car in a different cove when you arrived and adjusted your seat slightly from where you were sitting the previous day. Signal and noise clump together and the signal is normally a big element that runs through everything making everything pretty predictable. Of course, it’s possible to get disrupted on the way to the office, to be called home for an emergency. Or you can take a ‘moment’ and go fishing instead. But essentially the signal is a fairly high component of your wavefunction.
It is the same as stock charts. This is why moving averages are so popular. The less efficient the market, the bigger the signal. I consider crypto to be a rather inefficient market, and it certainly was. As such, it fit quite well into my technical analysis. It is possible to see the noise on the Bitcoin chart and the fractals in it.
Fractals are a bit of a mystery to humans. But you can imagine them like this: take a copper plate and a hammer; hammer the paper as many times as you want. Pretty soon you have a repeating fractal pattern on the copperplate that is very recognizable and hard to predict. This is because the pattern is created on roughly the same metal substrate by roughly the same motion acting with roughly the same force within a limited space by the same hammer face.
“I predict the level of 12 thousand dollars for Bitcoin”
Nature is full of these fractal patterns. Because rain falls on roughly the same mountain in roughly the same way, roughly the same waves hit roughly the same shore, and roughly the same wind blows on roughly the same puffy cloud, and so on. More or less the same people in the markets make more or less the same decisions. Now, I think you understand. What happens if we inject fractals into graphs? ‘Roughly’ is the random item, the rest is the signal. Of course, a massive meteor strike will ruin the party, the markets and everything. However, if these processes are left undisturbed, they produce patterns that reveal the processes themselves. Here is the chart of Bitcoin (BTC):
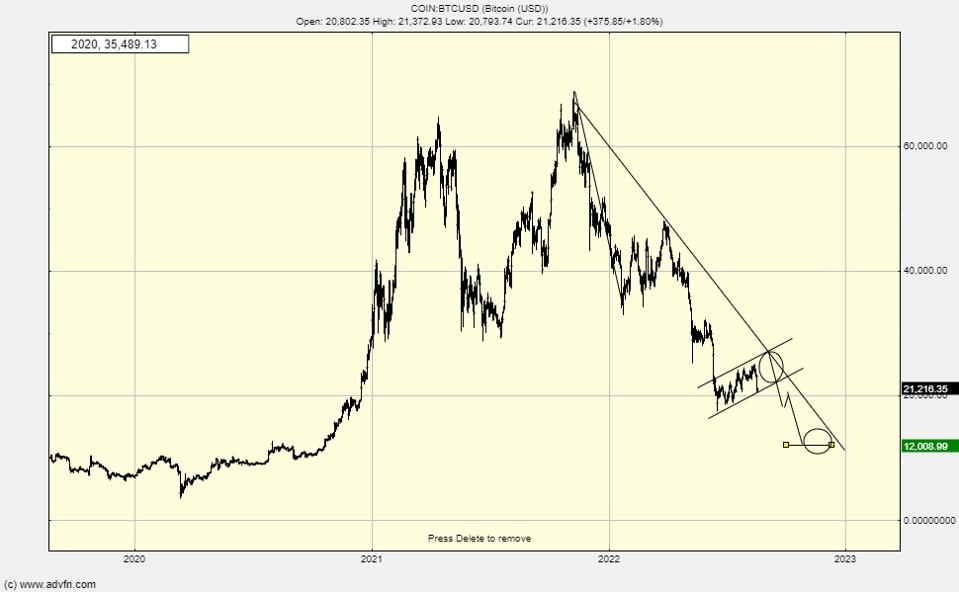 Bitcoin projection
I drew some speculative lines on it. I’ve been predicting this $12,000 to $13,000 level for a very long time. One way or another it will happen. If you look back, you’ll see that I called crypto from 2020 lows and recalled it back below $20,000. In a way, I’m comfortable at $20,000 for Bitcoin. I’m about to resist the temptation to start a slow savings program at these prices.
As a Bitcoin and crypto believer, I predict long-term prices will be multiples of current levels. So it’s no big deal to buy now and watch the price halve. Losses will be deleted later. However, I resist, I’m not such an optimistic investor. For now, I prefer to stay away with a strong intuition that there is another leg.
“There is a huge metaphorical asteroid in crypto that could turn things upside down”
Bitcoin could drop to $10,000 at any time. But underestimating the time it takes for an asset to drop low is an easy mistake to make. Then there’s a huge metaphorical asteroid that could turn things upside down in crypto. This, cryptocoin.com Ethereum (ETH) Merge, which is scheduled to be released in September, which you follow from . Meanwhile, the breakdown on Friday, August 19, 2022 was most likely due to the option expiration. So until Ethereum Merge, crypto in general remains a waiting game.
My view is that we are in a bear market recovery. Also, the bottom of the eventual bear market is not yet formed and there is no satisfactory moment of capitulation. For uncertain investors, this should be a wait and see game. But there is still a lot of noise and volatility for traders to trade. Therefore, they have no reason to stop their risky ventures.