According to crypto analyst Yashu Gola, options data, macroeconomic catalysts and technical signals suggest a drop is on the table for Ethereum despite Merge. We have prepared the analyst’s reviews and comments for our readers.
Surge or purge
Ethereum (ETH) hit the low of around $880 in June. cryptocoin.com As you follow, it then rose by about 90% from there. However, he is not immune to downside risk in September. Much of the token’s upside is based on Merge, a technical upgrade that will make Ethereum a Proof-of-Stake (PoS) protocol scheduled for September 15.
However, despite posting impressive gains between June and September, Ether is still trading almost 70% below its record high of around $4,950 in November 2021. Therefore, the possibility of going lower remains on the cards.
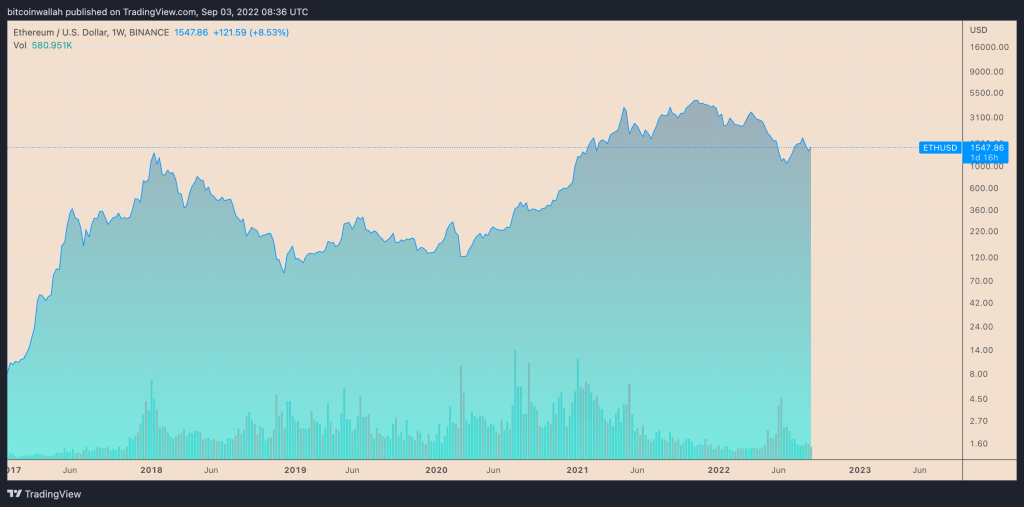 ETH weekly price chart / Source: TradingView
Here are three Ethereum bearish market indicators that show why more downside is likely.
Sell Ethereum Merge news
According to Deribit data compiled by Glassnode, Ethereum options traders expect ETH to reach $2,200 from the current $1,540 level before the Merge. Some even predict that the price will reach $5,000. But enthusiasm seems flat after the PoS transition.
After the Merge, there seems to be downward demand for protection among traders as indicated by the ‘options implied volatility smile’ metric (OIVS). OIVS shows the implied volatility of options for a given expiration date with different strikes. Thus, non-capital contracts typically indicate higher implied volatility. The opposite is also true.
For example, in Ethereum’s September 30 option expiry chart below, the steepness and shape of the smile helps traders assess the relative expensiveness of options and gauge what kind of tail risks the market is pricing in.
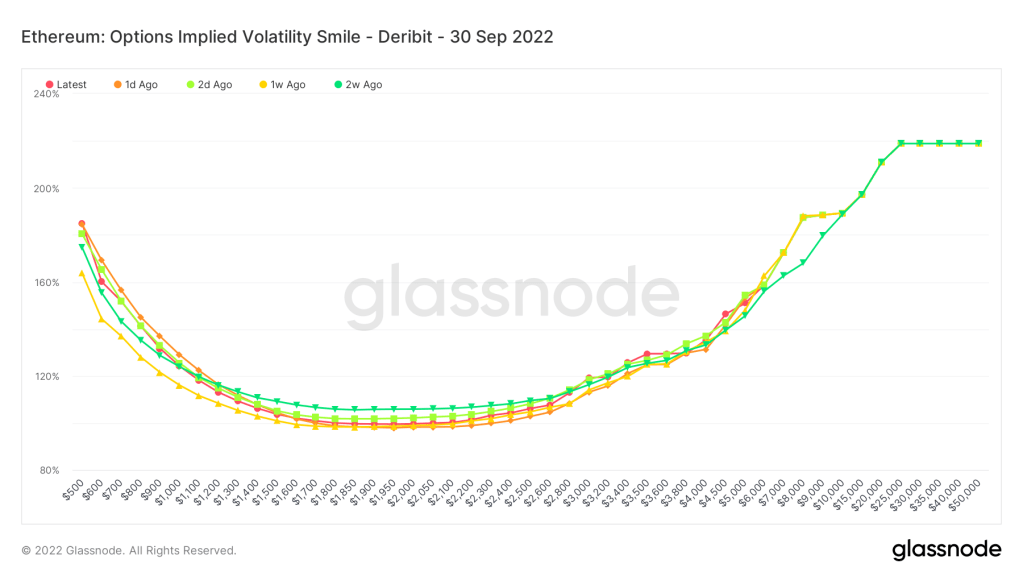 Ethereum OIVS for contract expiring September 30, 2022 / Source: Glassnode
Hence, it indicates a large buyer-side demand for ETH call options that ended in September, indicated by the upward slope of the volatility smile. It also implies that traders are willing to pay a premium for a long exposure.
Glassnode analysts refer to the OIVS chart below, which also includes Call and Put open interest at different strike rates. In this context, analysts said, “Post-Merge, left tail, pricing at significantly higher implied volatility. “This shows that traders pay a premium for post-merge ‘sell news’ option protection,” he says.
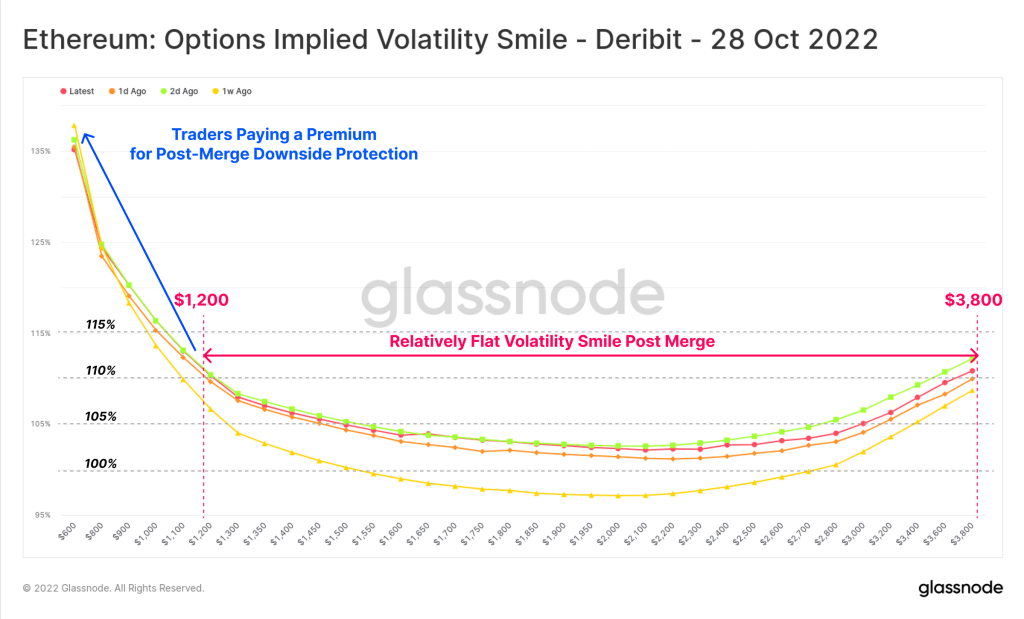 Ethereum OIVS for contract expiring October 28, 2022 / Source: Glassnode
In other words, ETH traders hedge their bets in the event of a news sell event.
Falcon Federal Reserve
More negative cues from Ethereum come from its exposure to macroeconomic events, primarily quantitative tightening (QT) by the Federal Reserve. Last week, Fed Chairman Jerome Powell reiterated the central bank’s commitment to lower inflation. He also stated that they ‘must continue until the job is done’. In other words, Powell and his partners will likely raise interest rates 0.5-0.75% at their next policy meeting in September.
Interest rate hikes have been bad news for ETH lately, given the growing positive correlation between the broader crypto sector and traditional risk-sensitive indices against declining cash liquidity expectations. For example, as of September 3, the daily correlation coefficient between ETH and Nasdaq was 0.85.
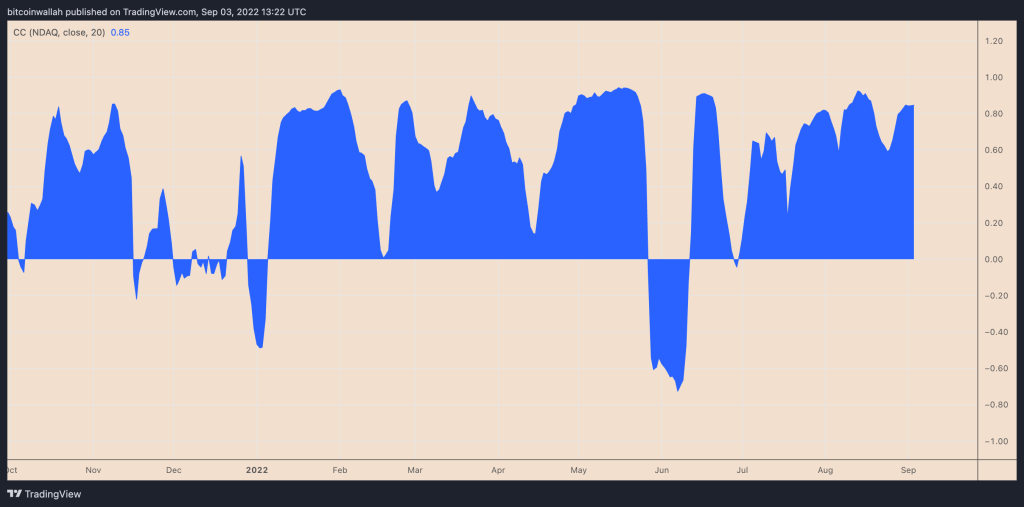 ETH and Nasdaq daily correlation coefficient / Source: TradingView
Therefore, there is a high probability that ETH will fall with riskier assets, especially if the Fed raises it by 0.75%.
Massive Ethereum ‘bear flag’
Technically, Ethereum is painting a bear flag on its weekly chart. Bearish flags appear when price consolidates higher within an ascending parallel channel after a strong downward move. It resolves after the price breaks down the channel. As a rule of thumb of technical analysis, it falls by the length (flagpole) of the previous downtrend.
ETH tested the lower trendline of the bear flag as support this week. From here, ETH will either rally to retest the flag’s upper trendline (~$2,500) as resistance or drop below the lower trendline to resume the prevailing bearish trend. Considering the factors discussed above, ETH risks entering the bear flag breakout phase in September, as illustrated in the chart below.
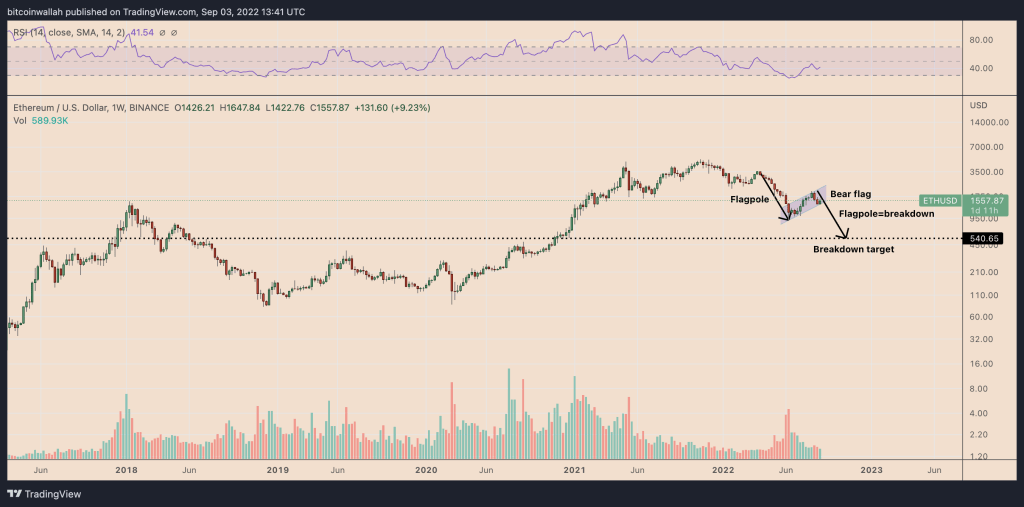 Weekly ETH price chart with ‘bear flag’ setup / Source: TradingView
Therefore, ETH’s bear flag target will be near $540 in 2022, down about 65% from today’s price.

