Analysts are still confident that Bitcoin (BTC) price action could break $23,000 as it enters the Ethereum Merge and awaits US CPI data. Meanwhile, a popular analyst says that the bottom of Bitcoin is here or very close.
$23,000 targets remain in place for Bitcoin
TradingView data showed that BTC hit $21,730 overnight on Bitstamp. cryptocoin.com As you follow, this is the highest level since August 26. BTC managed to hold on to its previous gains, although low volume weekend trading conditions were apt to amplify any weakness.
Excitement is high among analysts as we enter the new week that will be crucial for short-term crypto price action. Merge of leading altcoin Ethereum (ETH) will be in this week. Also, US inflation data will come. These are the most important catalysts that are expected to affect the market. “Expect increased volatility in next week’s economic data,” on-chain tracking resource Material Indicators shared over the weekend. In this context, he noted:
By the way, remember. This is a rally. If you don’t take profits along the way, you risk giving it all back.
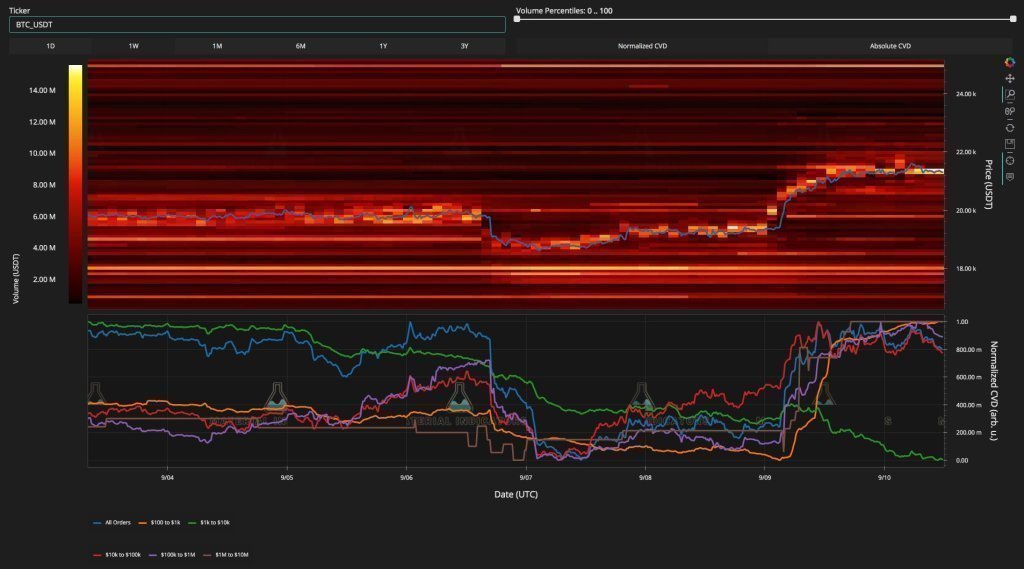 BTC order book data (Binance) / Source: Material Indicators / Twitter
An accompanying chart showed that the Binance BTC/USD order book provided solid resistance around $21,500, a zone where the bulls later overcame.
Between $22.5 and $23,000, there is room for additional bullishness, according to popular analyst Crypto of Capo.
Short squeeze is not over. 22500-23000 should be next.
— il Capo Of Crypto (@CryptoCapo_) September 11, 2022
However, the analyst added that there is a “90% probability” for BTC price action to return below $20,000 in the future.
$23,200 was also a target for analyst CJ, who watches various short-term levels for clues to long and short entry positions.
– Sweep equal highs at 21.9k and close back below July mid and I'll be looking for a short targeting the monthly open.
– Reclaim the mid or hold as support and we likely see a fast move into 23.2k pic.twitter.com/xv9oarffsA
— CJ (@IrnCrypt) September 10, 2022
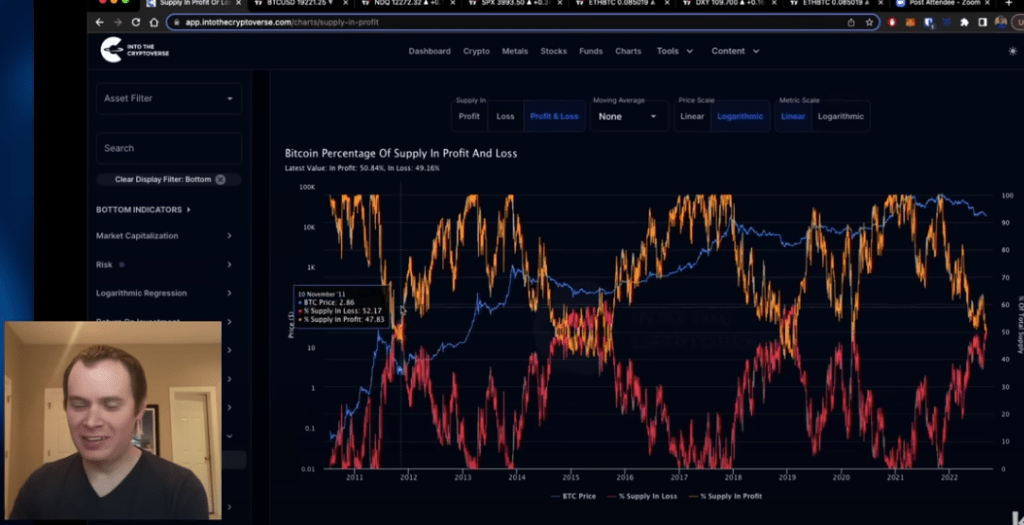
“Bitcoin bottom is here or very close”
Closely followed crypto analyst Benjamin Cowen says that a historically reliable on-chain indicator suggests that the bottom for Bitcoin is here or very close. Cowen removes Bitcoin’s supply from the profit and loss statement. This shows what percentage of BTC holders are at a profit or loss to their holders.
The popular analyst notes that the supply in the profit and loss metric for BTC has historically coincided with long-term highs and lows. Cowen also says that if BTC sees another drop or perhaps a capitulation, this indicator would strongly suggest that the bottom is in. In this context, the analyst makes the following statement:
Some of the charts that I think are the most interesting are things like supply in profit and loss. One of the interesting things about this chart is that historically Bitcoin never bottomed out until it did. Until they pass. They went through this cycle for the first time yesterday. And here it is possible to see a very cyclical pattern for Bitcoin supply and loss of profits. The bottom is formed after they have passed. When it comes to this is usually when you want to scale up while still pushing ATH levels. To me, this is an indication that if we put one more foot down, there is a lot of evidence that could be the bottom line.