Gold technical analyst Ross J Burland says gold bulls are in control with a deeper correction for next week. The analyst also points out the 61.8% gold rate on the daily chart. We have prepared Ross J Burland’s gold price technical analysis for our readers.
“DXY will likely support gold in this scenario”
Aaltı swept an important area on the daily chart, which was highlighted as the target area in last week’s pre-opening analysis. cryptocoin.com Thus, it closed Friday in positive territory, as you can follow. The moves came after the US dollar peaked in the middle of the week. However, analysts at TD Securities argue that the yellow metal is overvalued relative to the real rate. Analysts make the following assessment:
Those reported under Other continue to maintain their indifferent positions. We think there is an increased risk of a lower breakout in gold prices.
However, technically, there is still a case for a deeper correction, especially if the US dollar continues to reverse its course.
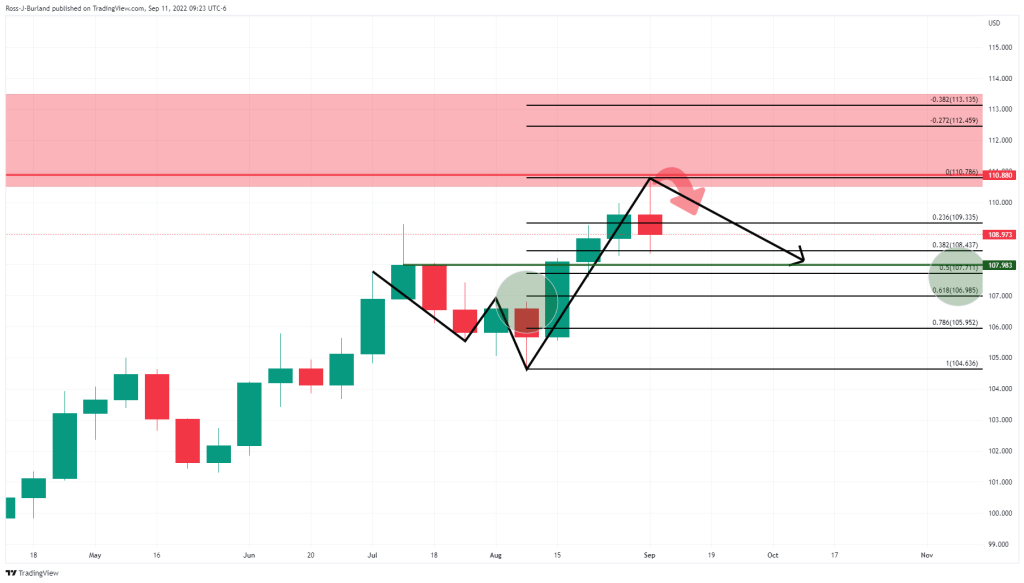 DXY weekly chart
The US dollar index (DXY) hovered around 110.80 the previous week. DXY then started to bounce back to its previous closing highs in mid-July with a 50% average return. After that, DXY has room up to the neckline of the W-form on a 61.8% Fibonacci retracement around 107. In such a scenario, this would likely favor the yellow metal. It also shows the bullish thesis in the charts below.
Gold price technical analysis
In last week’s pre-opening analysis, we noted that the price has recovered due to strong selling on the daily timeframe. The bulls were entering a 38.2% Fibonacci retracement with anticipation of a deeper correction as shown in the chart below.
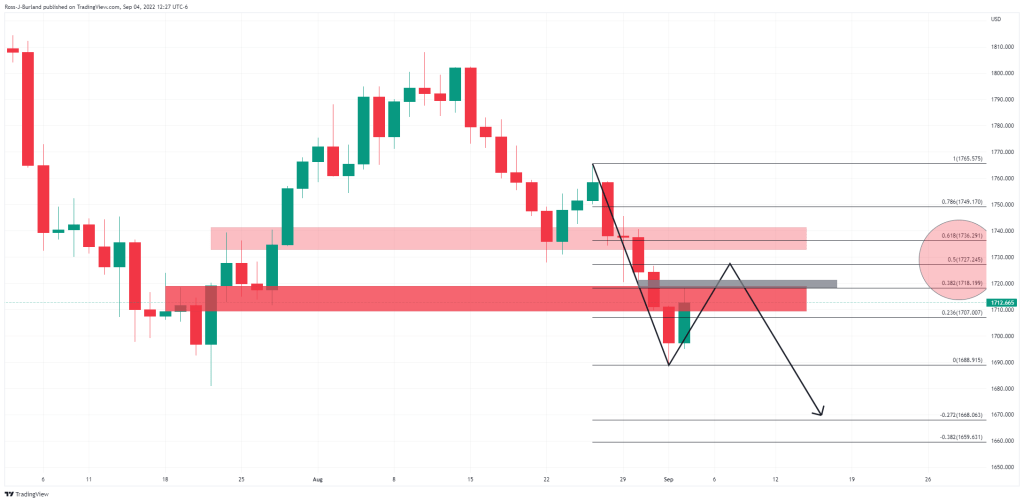
The price is headed towards a price imbalance near $1,721. Beyond that, a 50% average reversal comes in at around $1,727 to the previous build. If the bears give ground to the bulls, the final defense will be around $1,736 which is the 61.8% Fibonacci retracement.
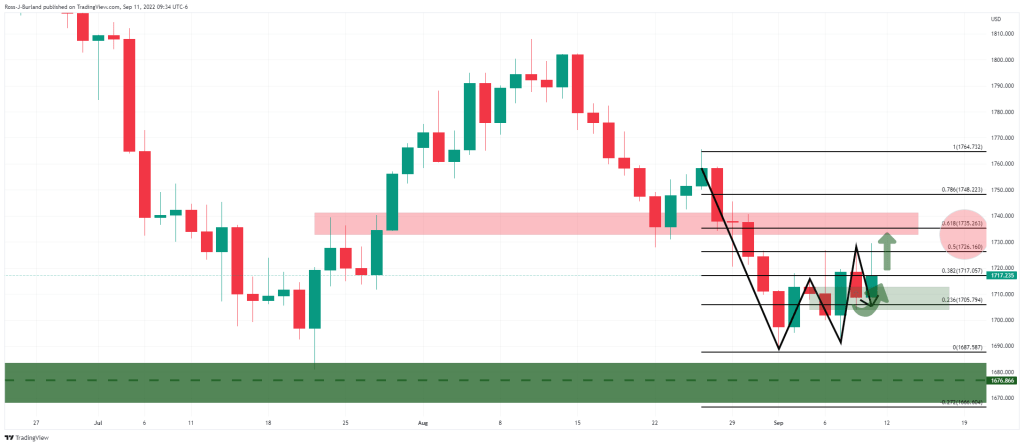
The daily chart shows the price pushing up the price imbalance around $1,721. Also, the 50% average retracement close to the previous structure stands at $1,727, with the highest ever level at $1,729. The neckline of a W-formation acted as a support for the next week leaving hopes for a move higher.
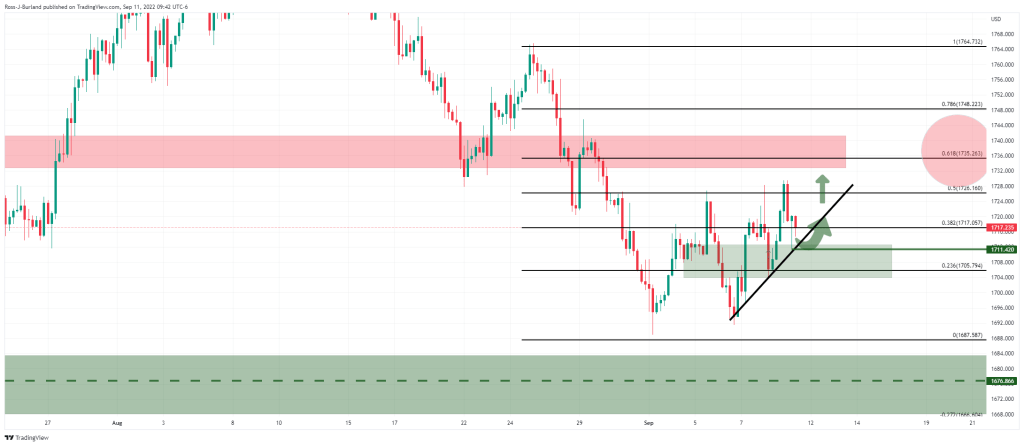
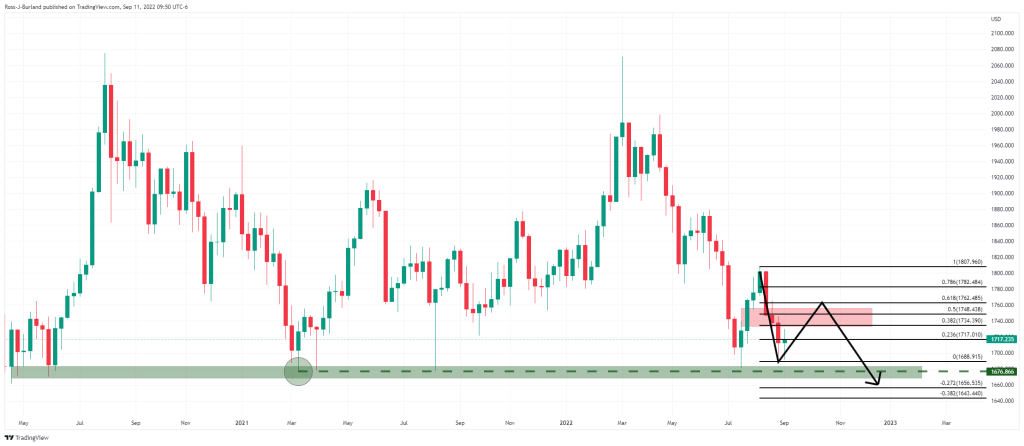
The recent low of the 4-hour chart at $1,711 is important for opening sessions. As long as the bulls can hold on there, the structure will continue to rise. It will also support a higher move towards the $1,735 resistance on a break of $1,720. However, a retest of 2021 lows is likely around $1,676. This means that the negativity will continue.