Technical analyst Ross J Burland notes that golden bulls could be in play earlier in the week. However, gold prices focus on $1,640 and see previous daily structures bearish.
“Gold prices are likely to fall further”
cryptocoin.com As you can follow, gold prices closed Friday with rising. However, the bears failed to break an important monthly support structure. The analysis below will show and explain possible scenarios for the start of the week and beyond.
Gold prices remain below $1,700 as US interest rates and the dollar continue to rise. Markets expect the Fed to raise rates by 75 bps or more at its meeting next week. Therefore, the precious metal complex is under pressure.

Meanwhile, exits from money managers and ETF holdings continue. According to analysts at TD Securities, this is putting pressure on prices. This ultimately raises the possibility of a capitulation from the few families and proprietary trading offices that hold contented gold. Analysts make the following assessment:
Continuing inflation continues to support the Fed’s aggressive efforts. We now expect FMOC to raise the target rate by 75 bps at its meeting next week. In addition, we anticipate an increase of 75 bps in November and 50 bps in December. In this context, although prices are certainly weak, gold prices are likely to fall further as the restrictive interest rate regime will last longer.
Bulls in play but $1,640 target for gold prices
Ross J Burland analyzes the technical outlook of gold as follows. From a technical perspective, the price is on the verge of a major breakout as shown below. However, if the bulls take action, an equally important rebound and a correction are possible, which seems unlikely given the underlying ground. However, potential resistances bring the previous lows below into focus.
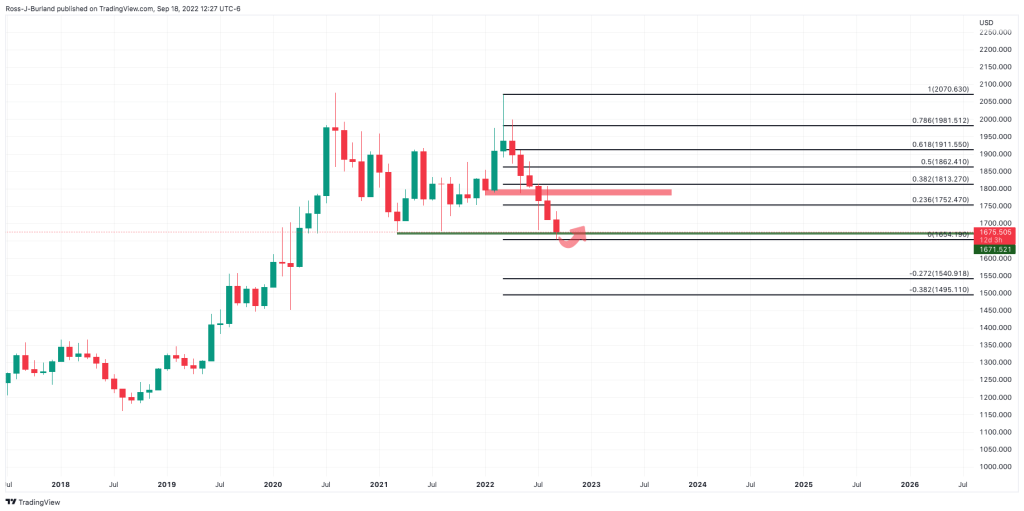 gold monthly chart
On the weekly chart, it is possible for the price to find resistance at the previous close as shown below. Thus, it will likely reach the lows of the previous days.
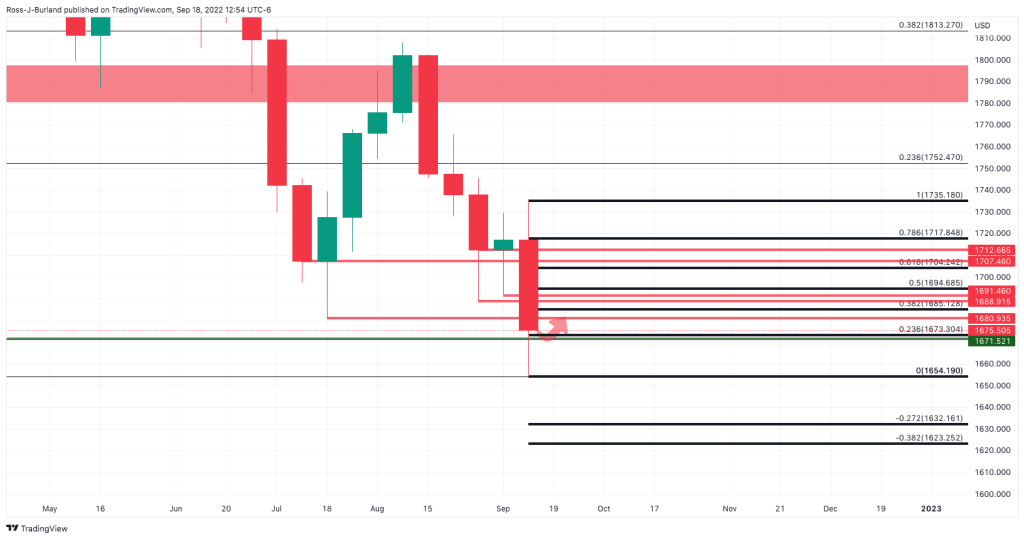 gold weekly chart
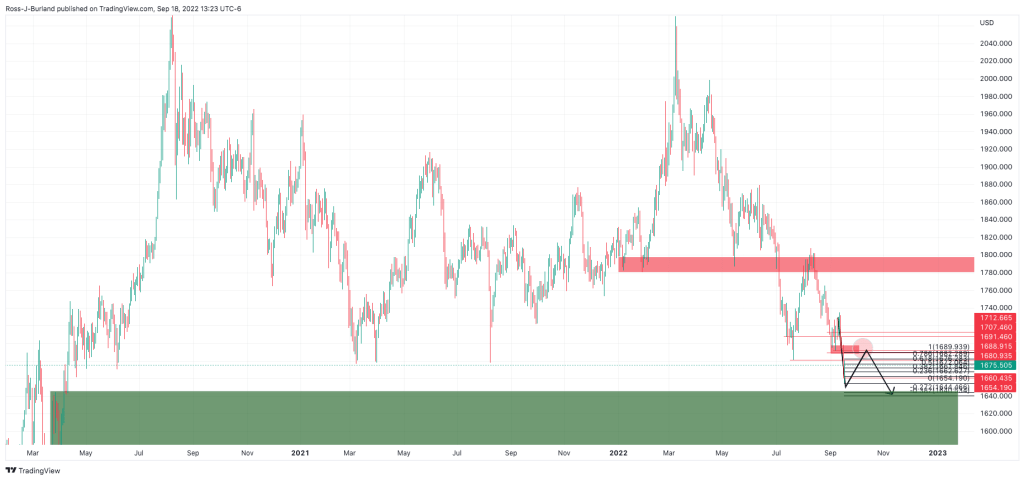
The daily chart reveals opening prospects as a bullish continuation of the correction that started on Friday and previous support in line with the 50% average reversal area near $1,695 as a possible target for opening sessions. All in all, downside will kick in if resistance persists for the coming days and expectations of a weekly break and a close below the $1,670 monthly support appear.
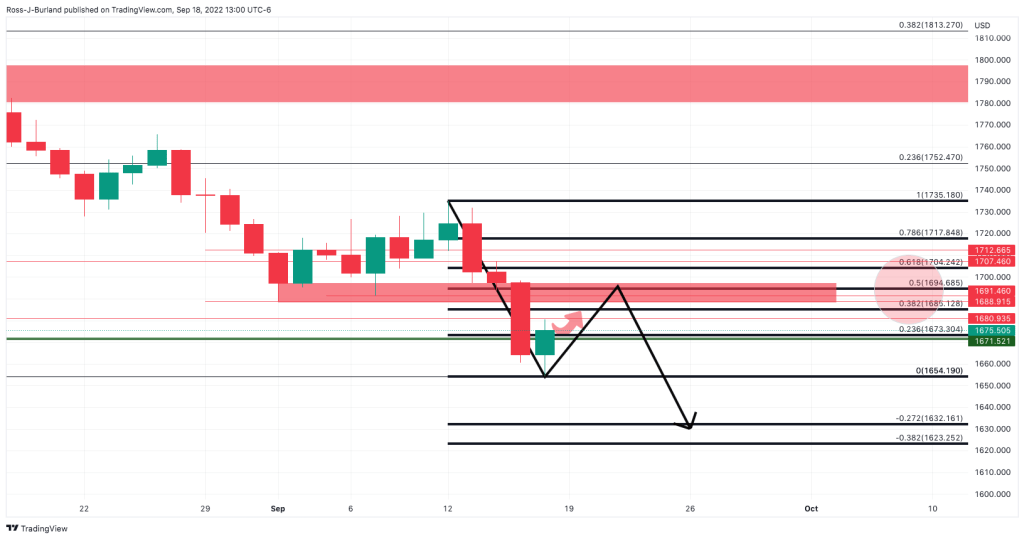 gold daily chart
This focuses on $1,640 on the daily chart below, making previous daily structures bearish.