While the altcoin market continues sideways, XLM price is trading at the bottom of an ascending parallel channel. New analysis points to a 2x boom in the short term, while the long term is bearish.
Stellar (XLM) technical analysis
Stellar (XLM) is forming a bullish pattern on the weekly time frame following the bullish divergence created by the RSI. This suggests a short correction before a long-term reversal. More broadly, we see XLM falling since its high of $0.798 in May 2021. In November of the same year, the price made a lower peak (red icon). Shortly after, it started to drop below a descending resistance line. The result of this move melted down to $0.099 in July 2022.
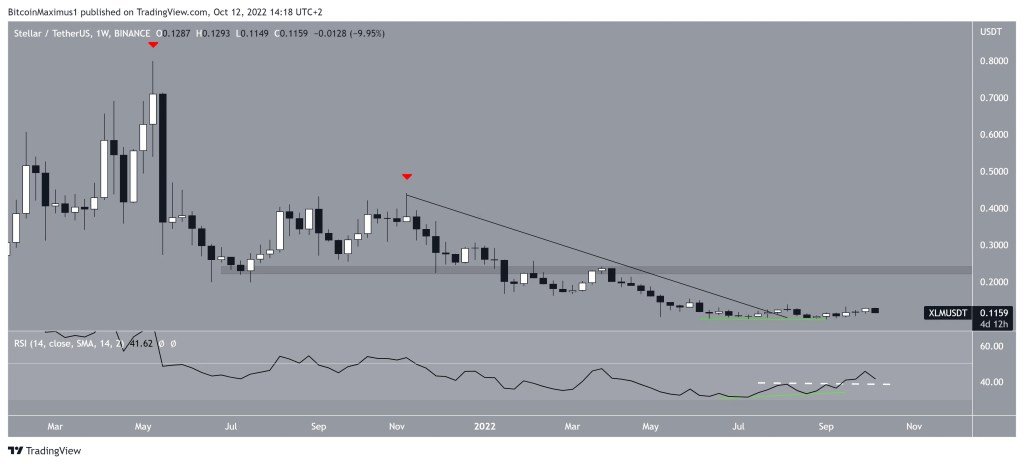
Stellar’s (XLM) price then changed direction and broke the descending resistance line. Additionally, the weekly RSI has created a significant bullish divergence as the price has fallen back to its pre-breakout levels (green line). One of these deviations has not yet occurred. But they often precede significant upward moves. If that happens, the nearest resistance point will be $0.235, as noted by analyst Valdrin Tahiri.
Altcoin price carries 2x potential
As an evidence, the weekly RSI broke above the divergence (white dashed line) high, supporting the possibility of a bullish price reversal. As a result of the bullish divergence, a price increase of $0.235 towards the XLM price target is the most likely outcome.
In addition, the annual Meridian 2022 event organized by the Stellar Foundation will take place from October 11-13. The founder of Stellar Global will be there, along with other prominent members of the company.
#Meridian2022 is rocking and I’m extremely happy to be here with the #StellarFamily @circlepay #XLM $USDC pic.twitter.com/Nqepj0Qzcm
— Sam 🔜 #Africa 🇰🇪 🇳🇬 (@samconnerone) October 11, 2022
XLM price fails to break above critical resistance amid stagnant altcoin market
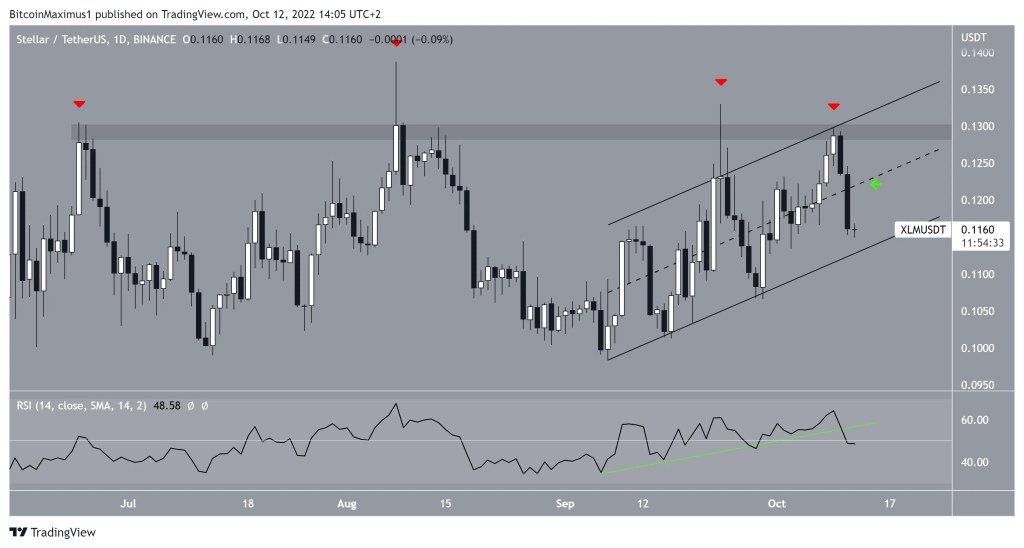
The daily price chart shows bearish readings despite the bullish outlook of the weekly time frame. Since seeing bottoms on September 7, XLM price has been climbing within an ascending parallel channel. Such channels typically contain corrective actions. Therefore, we may eventually see a deterioration. XLM price rallied to $0.129 on October 9. The resistance line of the channel and the $0.129 horizontal resistance area are both supported by the top.
He did this for the fourth time (red icons) in support. A downtrend began the next day, which intensified on October 11. The daily time frame shows a bearish trend. The daily RSI has deviated from an ascending support line and is below 50. (green line). Also, the midline of a parallel ascending channel has been breached by price (green icon). These readings indicate a channel failure is likely. If this happens, XLM price is expected to drop to yearly lows of around $0.100.
Future price action uncertain for Stellar
As a result, the weekly and daily RSI readings for Stellar price completely contradict each other. The first indicates that a price increase of more than 100% is about to begin, while the second indicates that a breakout from the current channel is expected.
Given the rejection of the $0.129 resistance area and a drop below the midpoint of the channel, a breakout from this is expected. After this correction is completed, the upward movement from the weekly time frame may begin.