
According to crypto analyst Rakesh Upadhyay, altcoins like MATIC are gaining as Bitcoin price continues to trade in a tight range. So, what are the levels that will signal the beginning of a continuous recovery in Bitcoin and altcoins? The analyst studies the charts of the top 10 cryptocurrencies to find out.
An overview of the cryptocurrency market
US stock markets started the new week with rising. The S&P 500 rose nearly 2.60% and the Nasdaq Composite rallied more than 3%. This is a sign that markets are ignoring September’s high inflation data. It also shows its focus on third-quarter earnings.
The recovery of the stock market may pave the way for Bitcoin (BTC) to break out of the range that it has been stuck in for the past few days. A positive sign for the bulls is that the amount of Bitcoin held or lost in cold storage has risen to a five-year high, according to Glassnode data.
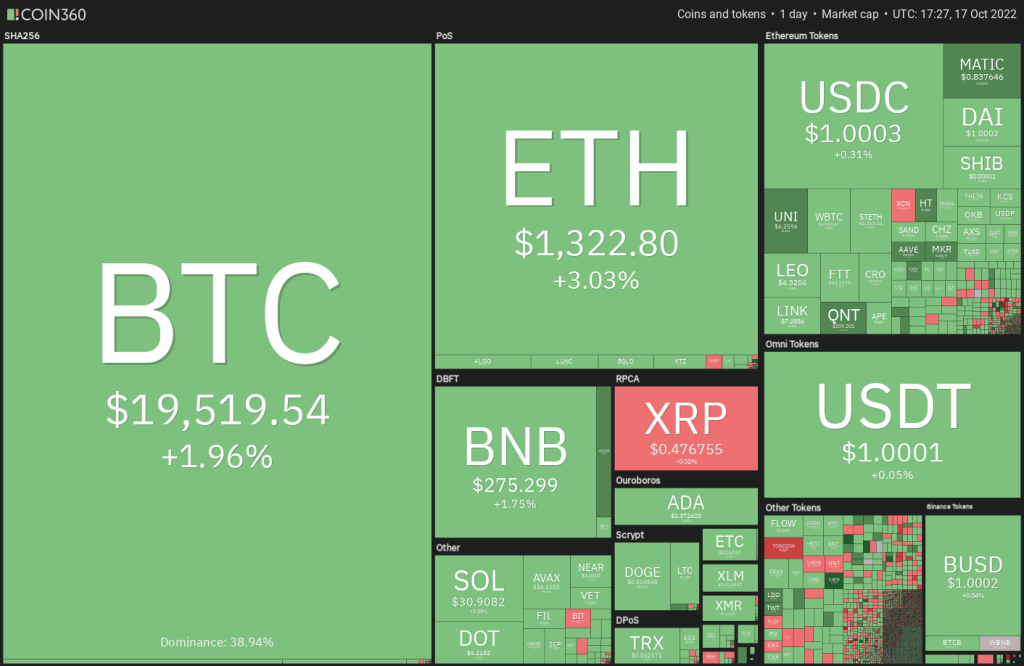
Daily cryptocurrency market performance / Source: Coin360
Long-term investors don’t seem in the mood to sell their holdings at lower levels. However, smaller investors seem to be making the most of the depressed prices. cryptocoin.com As you follow, Glassnode data shows that the number of wallets holding one full Bitcoin or more has risen sharply in 2022. Now it’s time for analysis…
BTC, ETH, BNB, XRP and ADA analysis
Bitcoin (BTC)
Bitcoin broke above the 20-day exponential moving average ($19,410) on October 17. The bulls are attempting to extend the recovery above the zone between the 50-day simple moving average ($19,691) and the downtrend line.
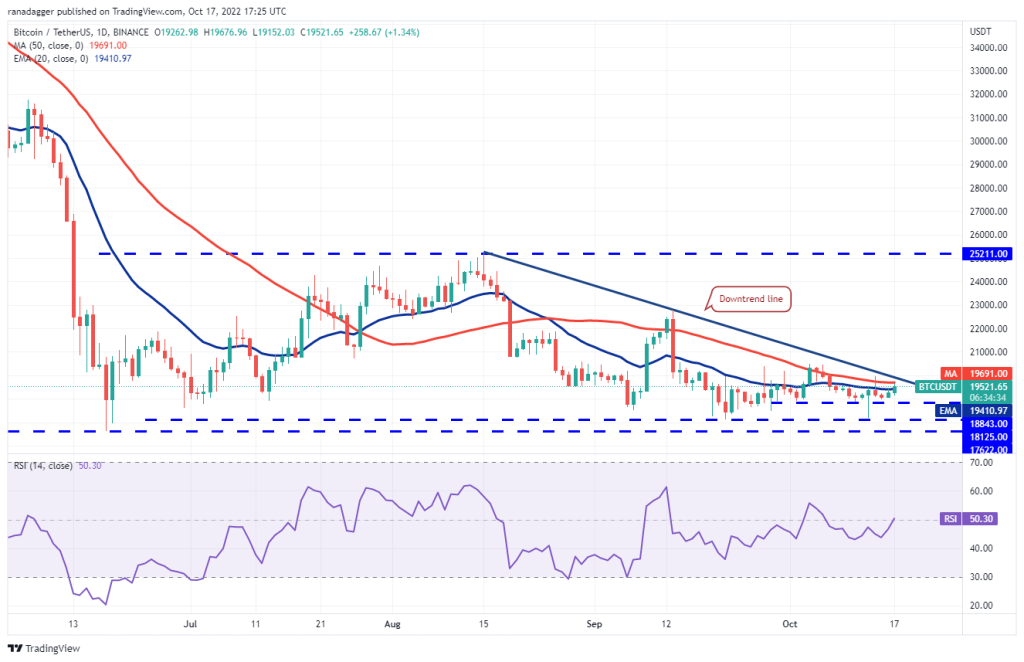
If they are successful, it is possible for BTC to rise to the hard resistance at $20,500. This level has been acting as a strong barrier since 14 September. Therefore, a break and close above $20,500 likely indicates that selling pressure will subside. It is possible for BTC to bounce back to $22,800 later, as there is no major resistance between them. This positive sentiment will be invalidated in the near term if the price turns down from the downtrend line and drops below $18,843. Such a move would indicate that the bears continue to sell at higher levels. BTC is likely to drop into the strong support zone between $18,125 and $17,622 later.
Ethereum (ETH)
ETH has reached the breakout level from the rebound triangle. The 20-day exponential moving average ($1,323) is close to this level. Therefore, it is possible for bears to aggressively defend the level.
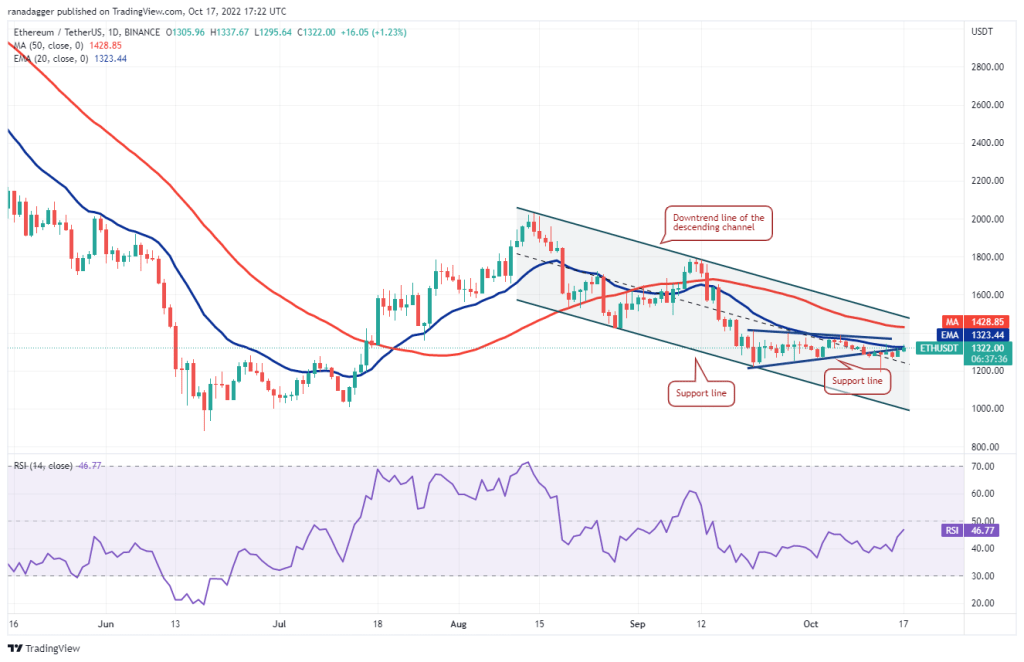
If the price declines from the current level and dips below $1,263, ETH is likely to retest the October 13 intraday low at $1,190. A break below this level will likely pull ETH to the support line of the descending channel. On the contrary, ETH is likely to rise to the downtrend line of the channel if the price rises above the overhead resistance at the 20-day EMA. This is a major hurdle for the bulls to overcome if they want to signal a potential trend change.
Binance Coin (BNB)
BNB has been consolidating between $258 and $300 for the past few days. The bulls are trying to push the price above the moving averages on October 17.
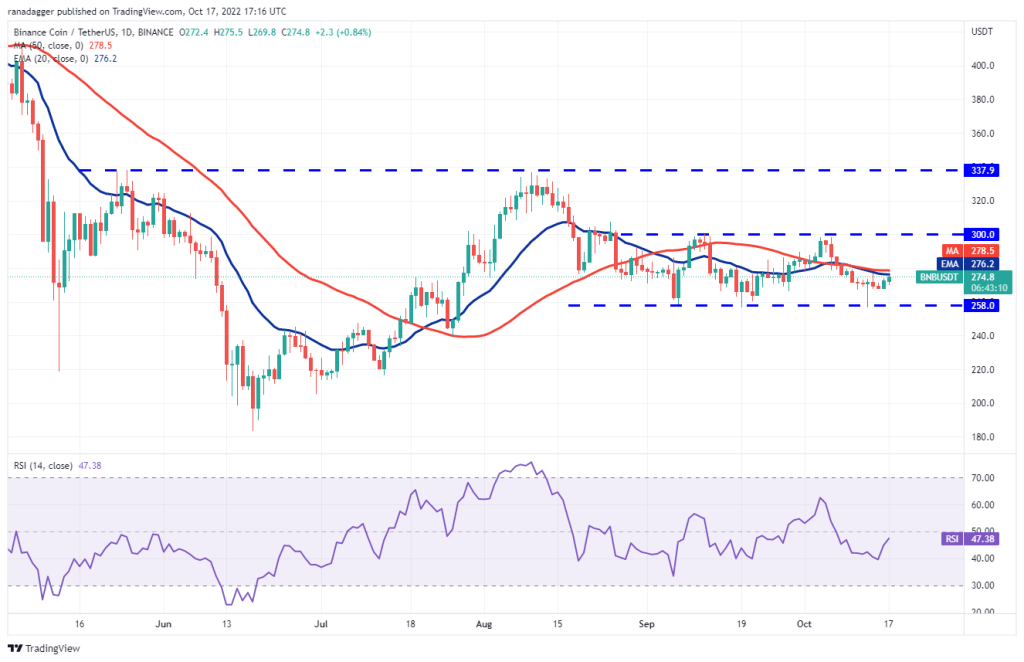
If they do, BNB is likely to attempt a rally to the resistance of the range at $300. The bears are likely to defend this level with all their might. A strong rejection at this level indicates that BNB will remain in range for a while. The bears will need to push the price below $258 to gain the upper hand. If they do, a drop to the next support at $216 is possible for BNB. On the contrary, BNB is likely to rise to $338 if buyers push the price above $300.
Ripple (XRP)
The price action of the last few days has formed a large symmetrical triangle for XRP (XRP). Buyers tried to push the price towards the resistance line of the triangle on October 14. However, the long wick on the candlestick shows aggressive selling at higher levels.
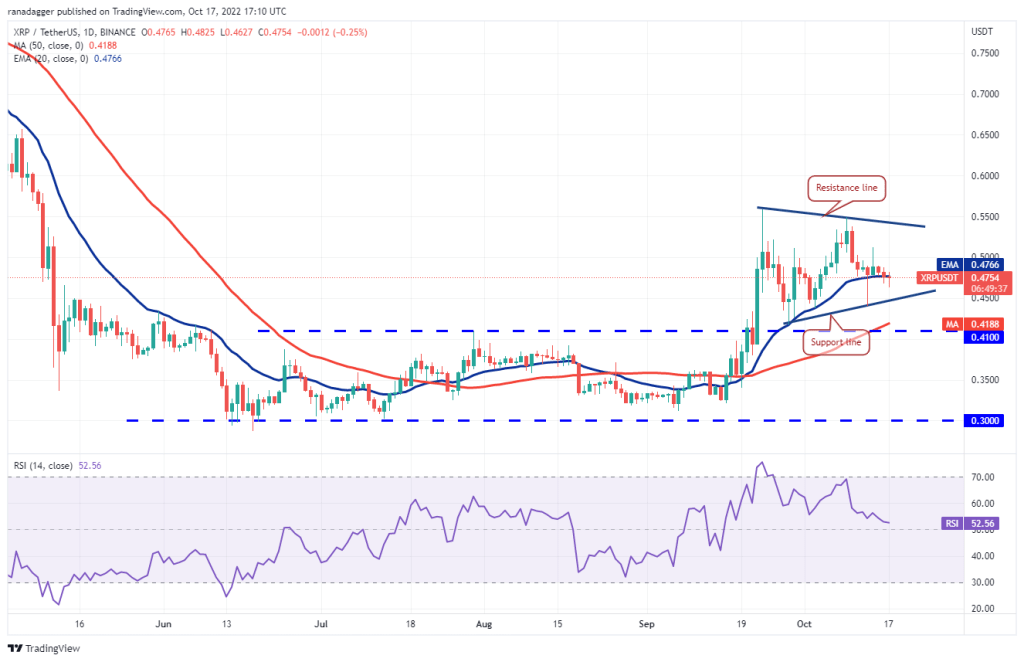
If the price stays below the 20-day EMA ($0.47), XRP is likely to slide to the support line of the triangle. This level may attract buyers and a strong recovery indicates that the pair may continue trading within the triangle. On the other hand, a break below the support line is likely to drop XRP towards $0.41. Trading within a triangle is often random and volatile. Although a triangle often acts as a continuation pattern, it is better to wait for the price to rise above the triangle before placing big bets.
Cardano (ADA)
The ADA has formed a falling wedge pattern. The price bounced off the support line of the wedge on Oct. 13 and the bulls are trying to push the price towards the 20-day EMA ($0.40).
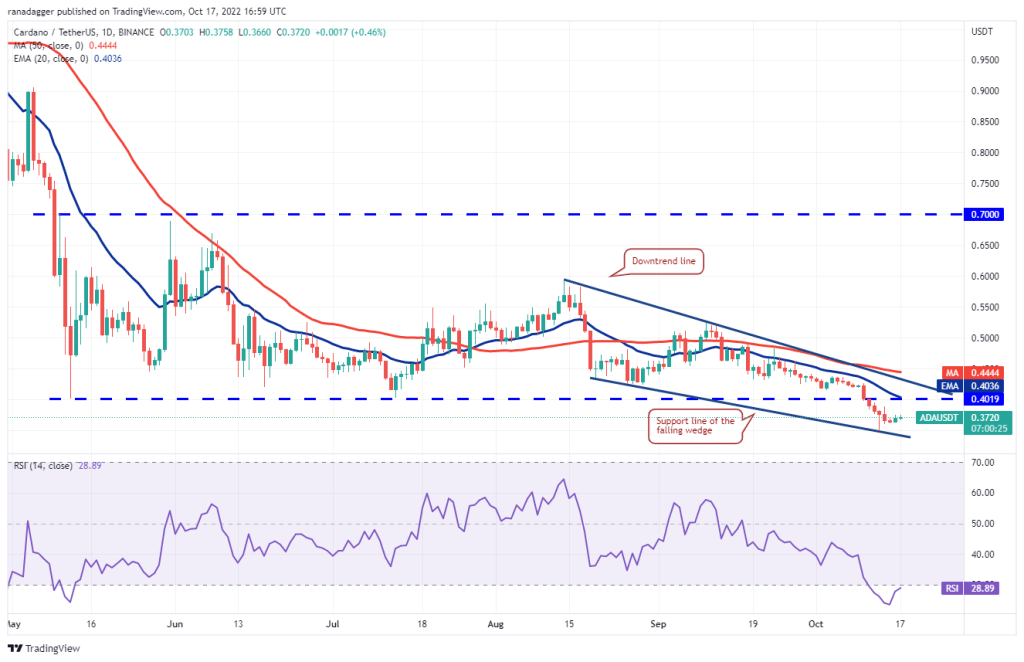
In the downtrend, the bears are vigorously trying to defend the 20-day EMA. If the price breaks down from this resistance, it is possible for ADA to drop back to the support line. The downward sloping moving averages and the relative strength index (RSI) in the oversold region suggest that the bears are in control. Buyers will need to push the price above the 20-day EMA to gain the upper hand in the near term. ADA is likely to reach the downtrend line after that. This level will act as a strong resistance. However, if the bulls push the price above this, a rally to $0.52 is possible.
SOL, DOGE, DOT, MATIC and SHIB analysis
Left (LEFT)
SOL broke below the $30 support on October 15 and closed. However, the bears did not take advantage of this weakness. This indicates that sales are drying up at lower levels.
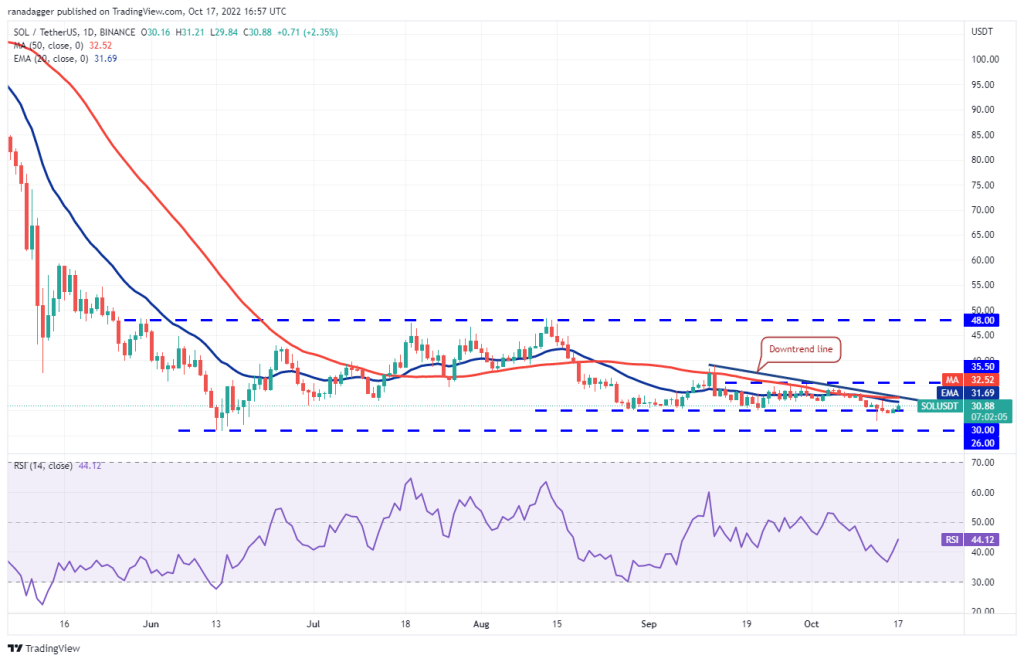
Buyers pushed the price above the $30 breakout level on Oct. Thus, it tries to extend the recovery up to the downtrend line. The bears are likely to build a strong defense at this level. If the price turns down from the downtrend line, a drop of the SOL to $29.42 is possible. A break below this level will likely pull the SOL to $27.87. On the upside, SOL is likely to rise to $35.50 if the buyers price rises above the bearish line.
Dogecoin (DOGE)
DOGE is approaching the moving averages to recover. This is an important level for bears to defend. Because a break above the 50-day SMA ($0.06) would likely allow a potential rally to reach $0.07.
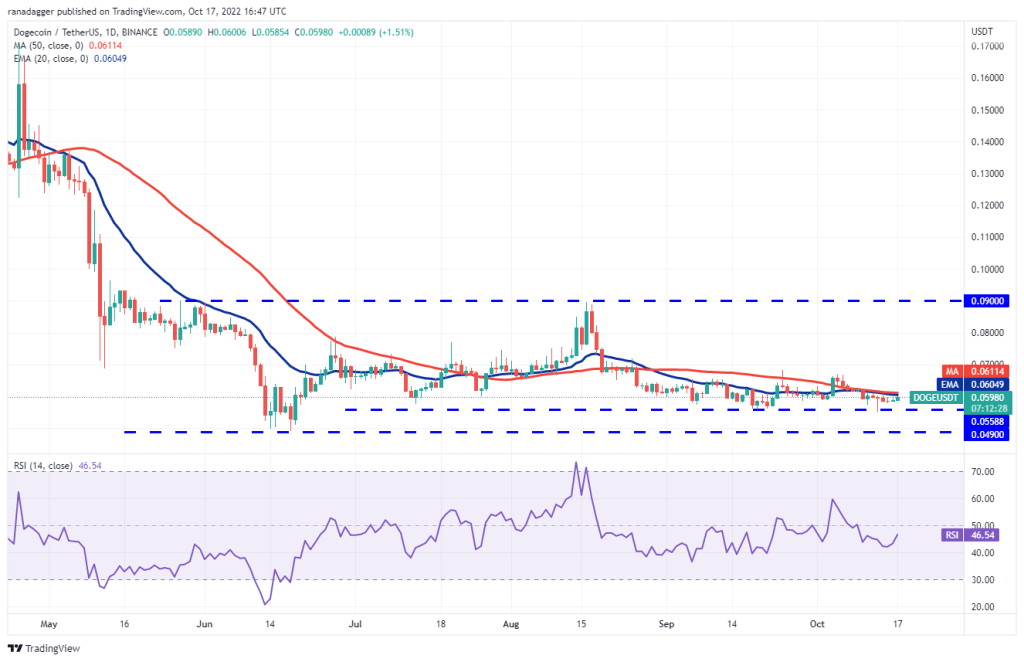
If the price declines from $0.07, it is possible for DOGE to drop back to support around $0.06. This will likely keep DOGE between these two levels for a few more days. The 20-day EMA ($0.06) and the RSI just below the midpoint indicate a consolidation in the near term. If the bulls pierce the overhead resistance at $0.07, DOGE is likely to attempt a rally to $0.09. Such a move would bring the big gap between $0.05 and $0.09 into play. Another possibility is that the price is falling sharply from the moving averages. If that happens, the bears will make another attempt to pull DOGE to the $0.05 support.
Polkadot (DOT)
The failure of the bears to hold the DOT below $6 on October 13 started a recovery, reaching the 20-day EMA ($6.29) on October 17.
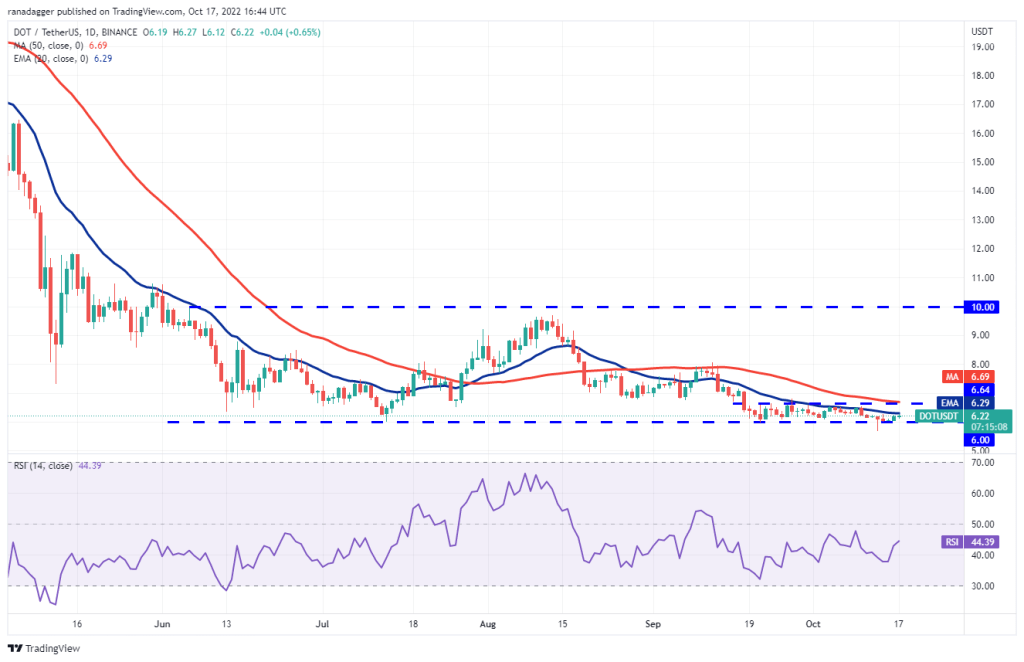
If the bulls top it, DOT is likely to gain momentum and move higher towards the overhead resistance at the 50-day simple moving average ($6.69). This level is likely to attract strong selling by the bears again. If the price breaks down from this resistance, it will likely extend the DOT’s stay in the $6 to $6.64 range for a while. It looks like the next trend move will start after the bulls pull the price above the 50-day SMA or the bears push the DOT below $6. If the price drops below $6, it is possible to extend the decline to $5.36.
Polygon (MATIC)
After several failed attempts over the past few days, the bulls finally managed to push Polygon (MATIC) above the downtrend line on October 17. This is the first sign of a potential trend change.
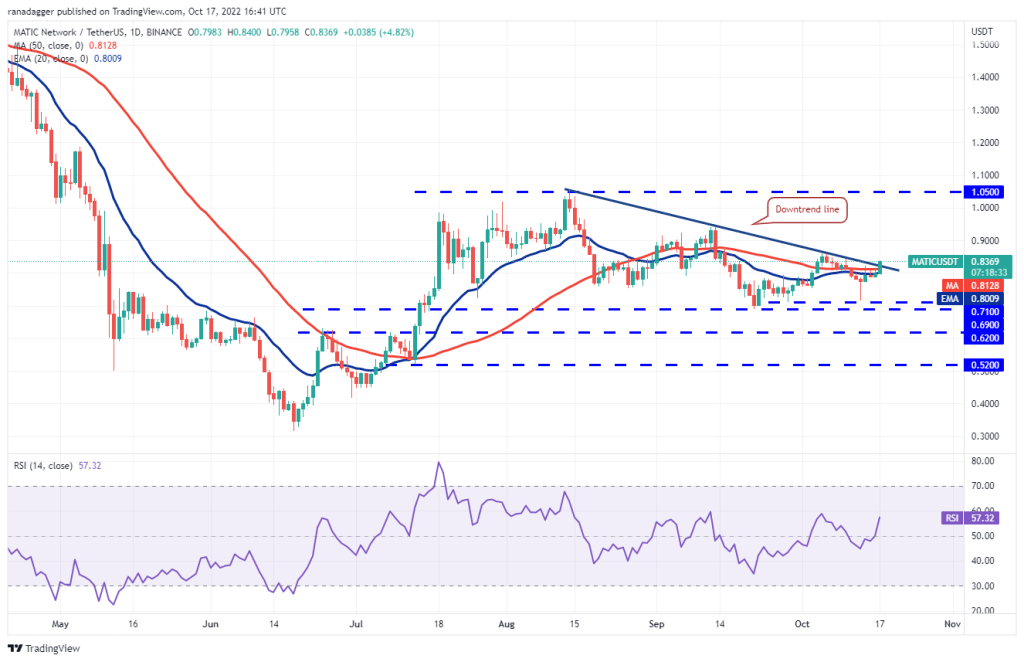
MATIC will likely rise to $0.86 first. If this level is exceeded, it is possible for the relief rally to reach $0.94. Flat moving averages suggest a balance between supply and demand for MATIC. However, the RSI in the positive territory indicates that the momentum will turn in favor of the bulls. Contrary to this assumption, if MATIC buyers fail to hold the price above the downtrend line, it will indicate that the bears are active at higher levels. Sellers will have to push MATIC price below $0.75 to gain the upper hand in the near term.
Shiba Inu (SHIB)
Shiba Inu (SHIB) is attempting to break the support at $0.000010. However, recovery has no power. This shows that traders are in no rush to buy at current levels.
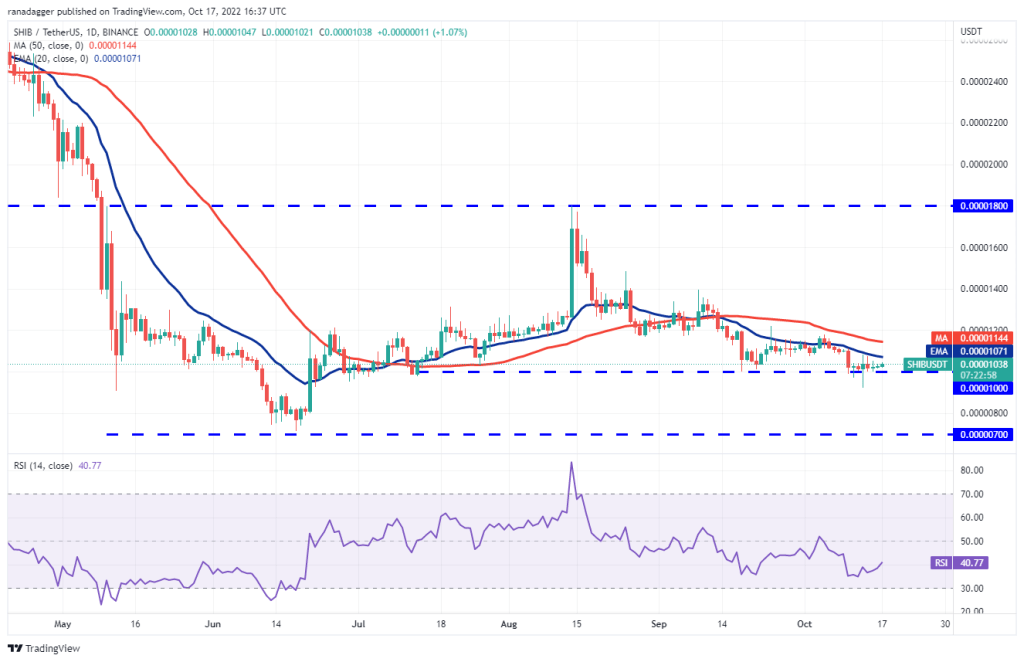
Both moving averages are sloping down and the RSI is in the negative territory. This gives an advantage to the sellers. If the price declines from the current level or moving averages, the bears will again attempt to push SHIB below $0.000010. If they do, it is possible that the sell-off will intensify and the SHIB falls towards the vital support of $0.000007. Alternatively, if buyers hold the price above the moving averages, SHIB is likely to rise to the overhead resistance at $0.000014. A break above this level is possible to indicate that the bulls are on a reversal. SHIB is likely to rally to $0.000018 later.