According to crypto analyst Tony M, network activity of the leading altcoin Ethereum marks the red days. Analyst John Isige explains why another free fall in the price of Binance Coin would not be a surprise. According to analyst Filip L, Cardano is in clear and present danger. We have compiled analysts’ analysis of ETH, BNB and ADA for our readers.
“Leading altcoin preparing for a correction”
On-chain metrics for Ethereum show that investors should be careful. According to Santiment’s 30-Day Active Address Indicator, more than 750,000 addresses became active in October. Statistically, once the indicator starts to rise, a sharp correction occurs in price shortly after.
 Santiment’s 30-Day Active Address Indicator
The altcoin price is currently up for auction at $1,299. The bears successfully broke the 8-day exponential moving average (EMA). The Relative Strength Index also made the final rejection in the ideal zone for a strong downtrend. If market conditions are truly bearish, Ethereum is likely to continue its stride southward towards $1,220 and lower.
 ETH 8 Hour Chart
The bulls will need to push both the 8-day EMA and the 21-day Simple Moving Average (SMA) above $1,330 to create an alternative bullish scenario. If the hurdles are overcome, a reasonable bullish scenario is possible. This marks the October high of around $1,380. Such a move means a 7% increase from the current Ethereum price.
“It is possible that these factors send BNB to $226”
The supply held by addresses between 10,000 and 100,000 increased from 3.14% in July to 3.33% in mid-August. Then it fell to 3.21%. BNB’s climb to highs near $300 was supported by the group’s holdings supply rising to 3.33%. However, with the chart below on a negative slope, BNB’s near-term future remains bleak. In other words, as whales avoid the token, selling pressure increases. This increases the chances of a long downtrend.
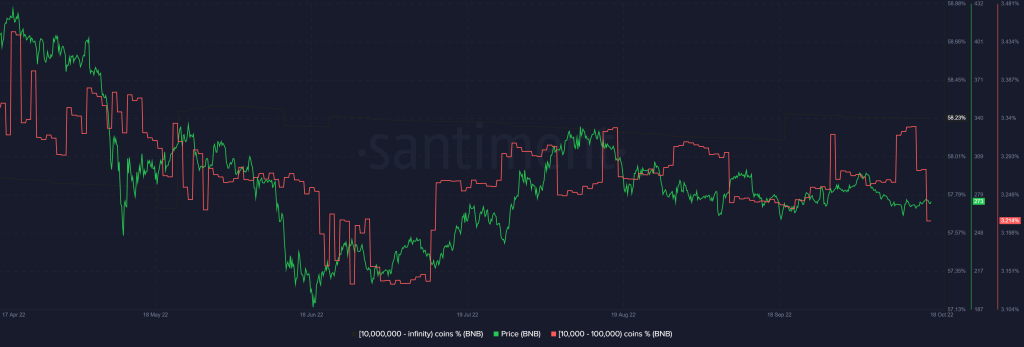 Binance Coin Supply Distribution
BNB technical outlook did not improve after free fall from highs near $300. A rectangular pattern on the daily chart confirms an untradable volatile market.
 BNB daily chart
Considering that the movement before its formation is a drop from the August peak, a bearish rectangle comes into play in the middle of the downtrend, as in BNB. Sellers often repurchase the asset after a break. Therefore, the predicted movement will be lower. Normally, the length of the breakout is equal to the height of the rectangle predicting a drop to $226. To short BNB, traders must wait for a confirmed move below the rectangular baseline before activating their orders.
Directional Movement Index (DMI), which adds confidence to the possibility of another leg up to $226. A sell signal will occur when the 12-day EMA (Exponential Moving Average) orange turns below the 26-day EMA (blue). On the other hand, if the bulls manage to climb above the 100-day SMA (Simple Moving Average), the blue $278 and the 50-day SMA (red) at $281, it is possible for BNB to temporarily escape the 13.17% bearish move below the breakout point.
An upside break cannot be ruled out. Stubbornly bullish traders may consider taking profits at $300 on the rectangular ceiling or $320 on August highs.

“ADA is in clear danger”
Altcoin price action makes traders ask why it is so important to follow developments in the UK. The reason is very simple. cryptocoin.com As you follow, global markets are still being squeezed by inflation. Also, central banks are trying their best to control it. The largest and most vulnerable economy to suffer this is the UK, where current turmoil is guiding the US and Europe. If the UK economy collapses and sees a serious recession, it is inevitable that the US and the eurozone will be hit by a recession.
The altcoin price is therefore undergoing a correction. Wait for ADA to make new lows and look for the next level of support. For this, around $0.3240, which he saw on January 17, 2021, is reasonable. Looking back, more bottoms and a new two-year low lie ahead.
 ADA Daily chart
Alternatively, a quick turnaround is possible. This is due to another strong gain from the stock market. Of course, many tech stocks will report gains in the days and weeks ahead. So, it is possible that this will push the Nasdaq higher, which is highly correlated with the crypto market. In such a scenario, expect some tailwinds to kick in. In this case, ADA is likely to rally to $0.39 and a possible break above the red descending trendline to open the door at $0.44.