
According to crypto analyst Rakesh Upadhyay, the S&P 500 and Bitcoin (BTC) have bounced from nearby support levels, showing that the bulls are not giving up and are likely buying the dips. The analyst studies the charts of the main cryptocurrencies, including BTC and DOGE.
An overview of the cryptocurrency market
The US 10-year Treasury yield hit its highest level since 2008. This type of rally is generally negative for risky assets. However, US stocks rebounded after the Wall Street Journal reported that some Federal Reserve officials were concerned about the pace of rate hikes and the risks of overtightening.
It is widely accepted that the US will enter a recession. However, there is ongoing debate about how long this will take. cryptocoin.com Regarding this, Tesla CEO Elon Musk recently said on Twitter that the recession could ‘probably last until spring 2024’. He also added that ‘it would be nice to have a year without a terrible global event’.
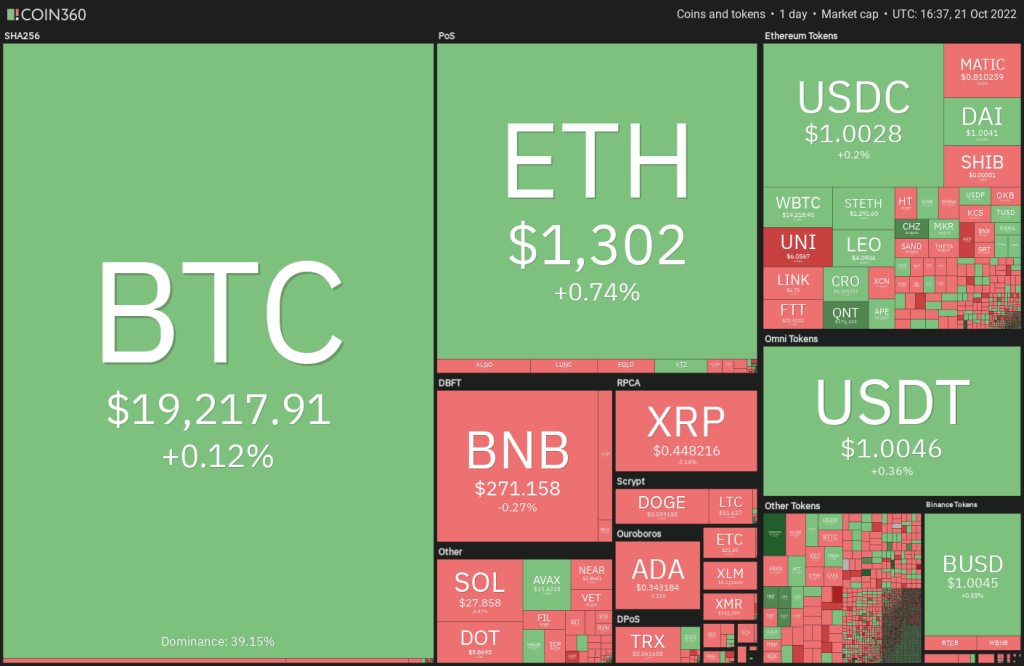 Daily cryptocurrency market performance / Source: Coin360
Bitcoin price witnessed a massive drop from its all-time high. However, the hash rate is still strong. According to Bloomberg Intelligence senior commodity strategist Mike McGlone, this puts Bitcoin’s discount from October’s hash rate to its highest level since the first quarter of 2020. The previous example of the big discount was followed by a massive rally that lasted until 2021. McGlone says the same thing will likely happen again this time around. He also suggests that Bitcoin will outperform most major assets. Now it’s time for analysis…
BTC, ETH, BNB and XRP analysis
Bitcoin (BTC)
Bitcoin bounced off the nearest support at $18,843 on October 20. However, the bulls failed to overcome the hurdle at the 20-day EMA ($19,318). This indicates that the bears want to further strengthen their grip.
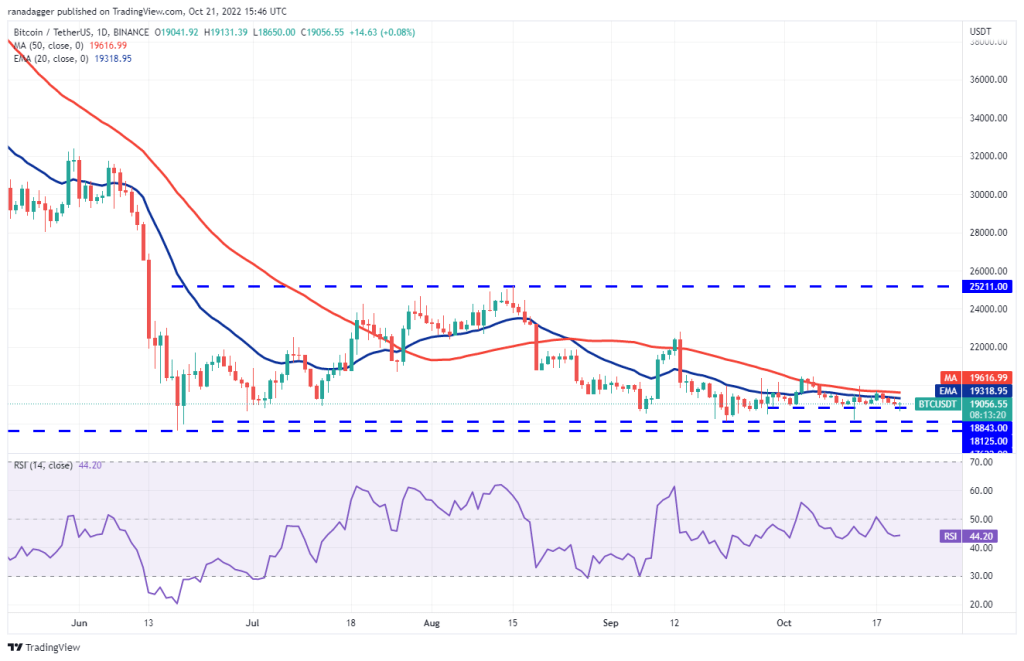
If the price slides and stays below $18,843, a drop to $18,125 is possible. The bulls will likely defend the zone strongly between $18,125 and $17,622. Because, if they don’t, it is possible that BTC will continue its downtrend. The next stop on the downside is $15,750.
The long tail on the October 21 candlestick shows buyers buying the dip below $18,843. They will try to push the price above the moving averages. A break above the 50-day SMA ($19,616) is likely to open the way for a possible rally to $20,500. This is an important level to consider. Because, a break above this is possible to indicate the start of a strong recovery to $22,800 followed by $25,211.
Ethereum (ETH)
ETH is struggling to break above the 20-day EMA ($1,313). However, a minor positive is that the bulls have not allowed the price to stay below the $1,263 close support.
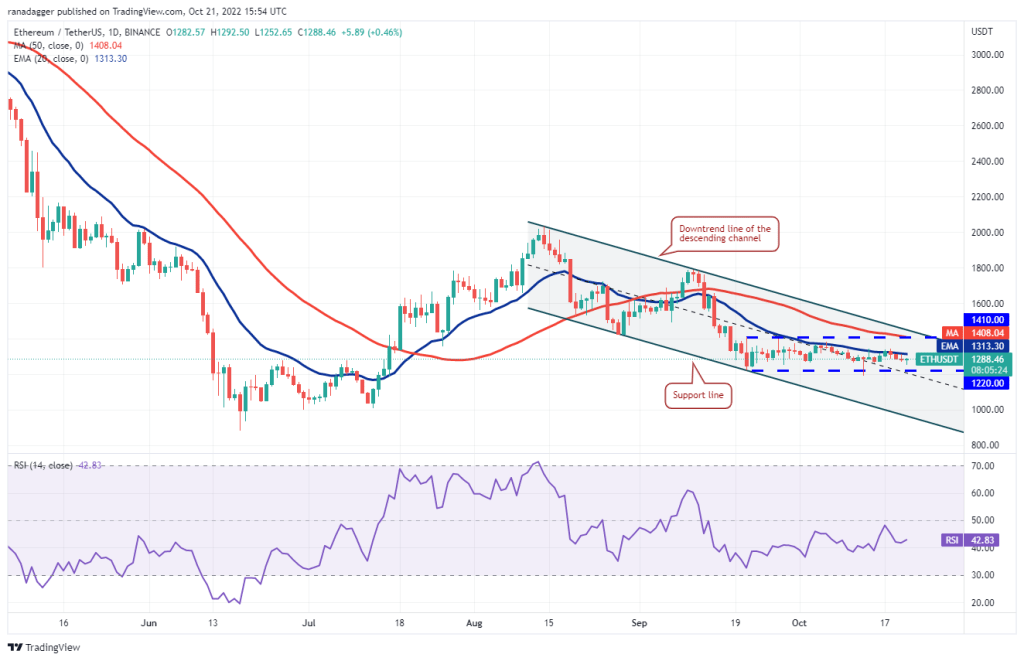
If the price rises from the current level and rises above the 20-day EMA, it is possible for ETH to rally towards the downtrend line of the descending channel. Buyers will have to push the price above this resistance to signal the start of a new bullish move. Conversely, if the price continues to decline and slides below the $1,220-1,190 support zone, an intensification of selling is likely. Thus, a drop to the psychological level of $1,000 and then to the support line of the channel is possible.
Binance Coin (BNB)
BNB is trading below both the moving averages and the bears are trying to push the price down to the support of the range at $258.
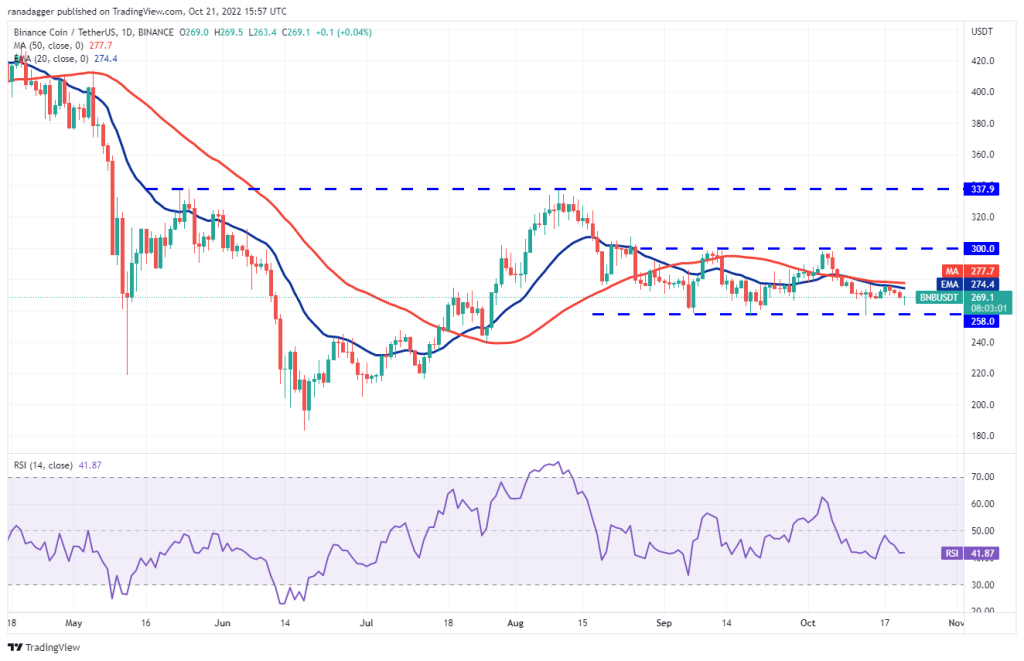
The gradually falling 20-day EMA ($274) and the relative strength index (RSI) in the negative zone point to the advantage for the bears. The $258 level is likely to witness a tough battle between the bulls and bears. If the sellers peak, BNB is likely to drop to $216. Instead, if the price rises above the current level or $258 support, the bulls will try to push BNB above the moving averages. If this happens, it is possible for BNB to attempt a rally to $300. This level is likely to act as a strong barrier. However, if the bulls surpass this, BNB is likely to rise to $338.
Ripple (XRP)
XRP fell below the developing symmetrical triangle pattern on October 20. However, the long tail on the candlestick indicates that the bulls are buying dips to the 50-day SMA ($0.43). Buyers again defended the 50-day SMA on Oct. 21.
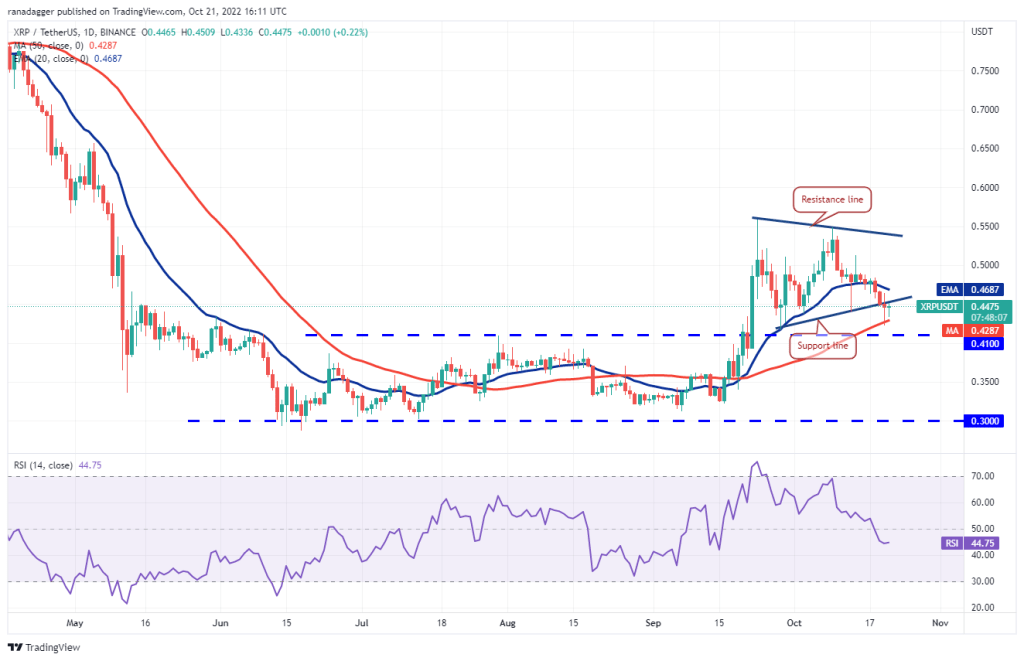
The 20-day EMA ($0.46) has started falling. Also, the RSI has slipped into negative territory, indicating that the bears have a slight advantage. If the price drops from the current level or the 20-day EMA, the bears will try to push XRP to the breakout level of $0.41. This level is likely to attract strong buying. On the upside, a break and close above the 20-day EMA will be the first indication of strength. XRP is likely to rally to $0.51 and then the resistance line later. A break and close above the triangle is possible to improve prospects for an uptrend resumption.
ADA, SOL, DOGE and MATIC analysis
Cardano (ADA)
ADA has been in a downtrend for the past few days. After a two-day relief rally, sales resumed on October 18. Thus, the bears pulled the price to the support line of the wedge.
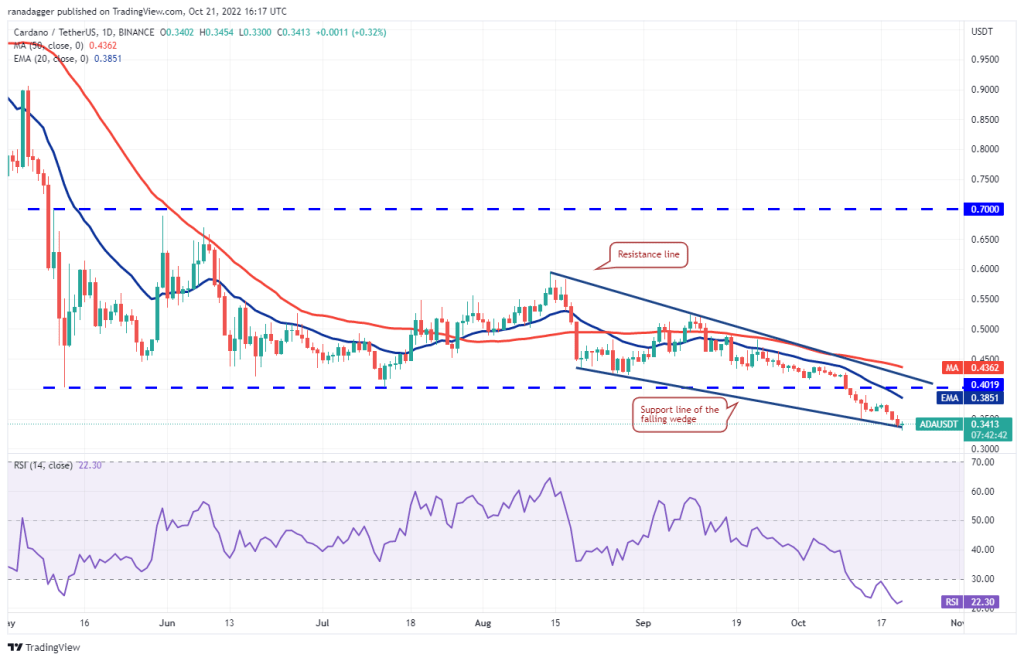
The sharp selling of the last few days has rounded the RSI into the oversold territory. This suggests that selling may have been overkill in the near term and a relief rally or consolidation is just around the corner. If the price breaks out of the support line, ADA will attempt to rise to $0.36 and then the 20-day EMA ($0.38). A break above this level will be the first indication that the bears will lose their grip. On the downside, if the price drops below the support line, selling could accelerate further and ADA could drop to $0.30.
Left (LEFT)
The SOL dropped below the $29.42 support on Oct. 19, signaling increased selling pressure from the bears. Selling continued and support at $27.87 was received on Oct. 21. This paves the way for a retest of critical support at $26.
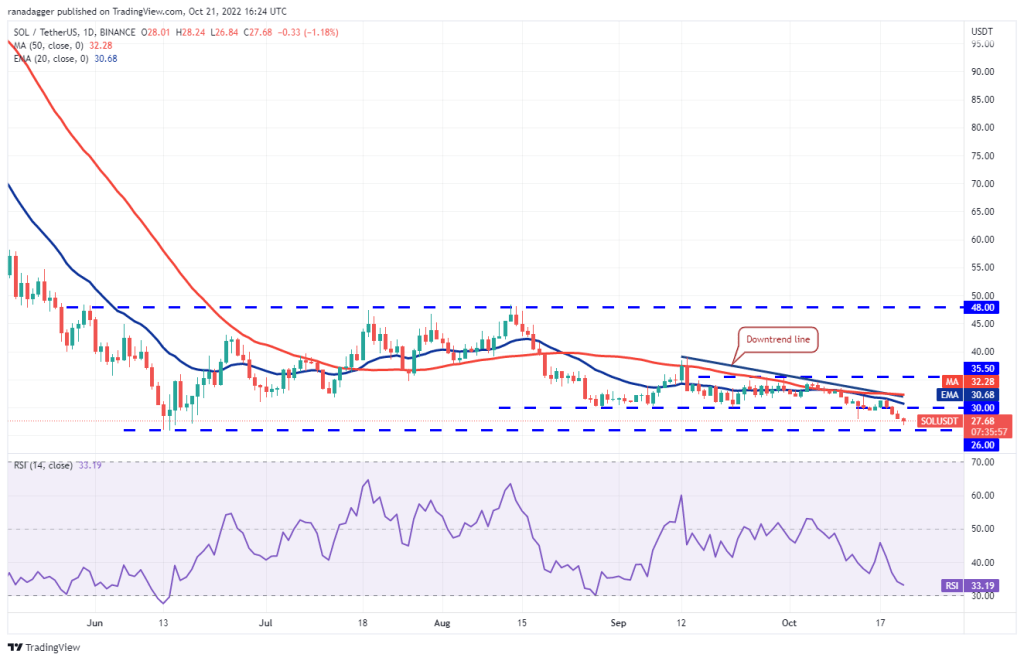
The falling moving averages and the RSI in the negative zone show that the bears are in control. If the SOL does not rebound sharply from $26, the probability of a break below it increases. SOL is likely to drop to the next support at $22 later. Contrary to this assumption, if the price rises from the current level or $26 and rises above $30, it will signal accumulation lower. After the SOL breaks above the 50-day SMA ($32.28), the bullish momentum is likely to rally in the near term.
Dogecoin (DOGE)
Attempts by the bulls to push Dogecoin (DOGE) above the moving averages have encountered significant resistance from the bears. Sellers will now attempt to lower DOGE price to support around $0.06.
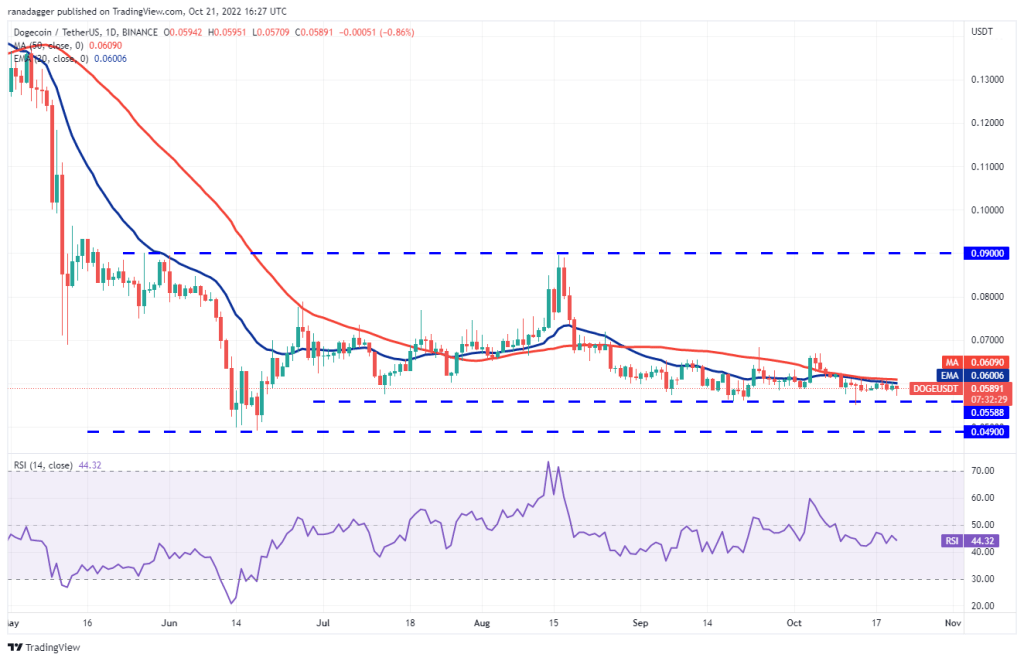
The falling 20-day EMA ($0.06) and the RSI below 45 suggest the DOGE bears have the upper hand. If the sellers sink the price below the support, the DOGE could drop to the June low of $0.05. Bulls will have to defend this level with all their might. Because if the support is broken, DOGE will probably start the next leg of the downtrend. If the bulls want to avoid a collapse, they will have to push the price above the moving averages quickly. DOGE is likely to rally to $0.07 later, where the bears will form strong resistance again.
Polygon (MATIC)
MATIC dropped from $0.88 on October 19 and settled below the moving averages on October 21. The inability of the bulls to defend the moving averages in the retest is a negative sign.
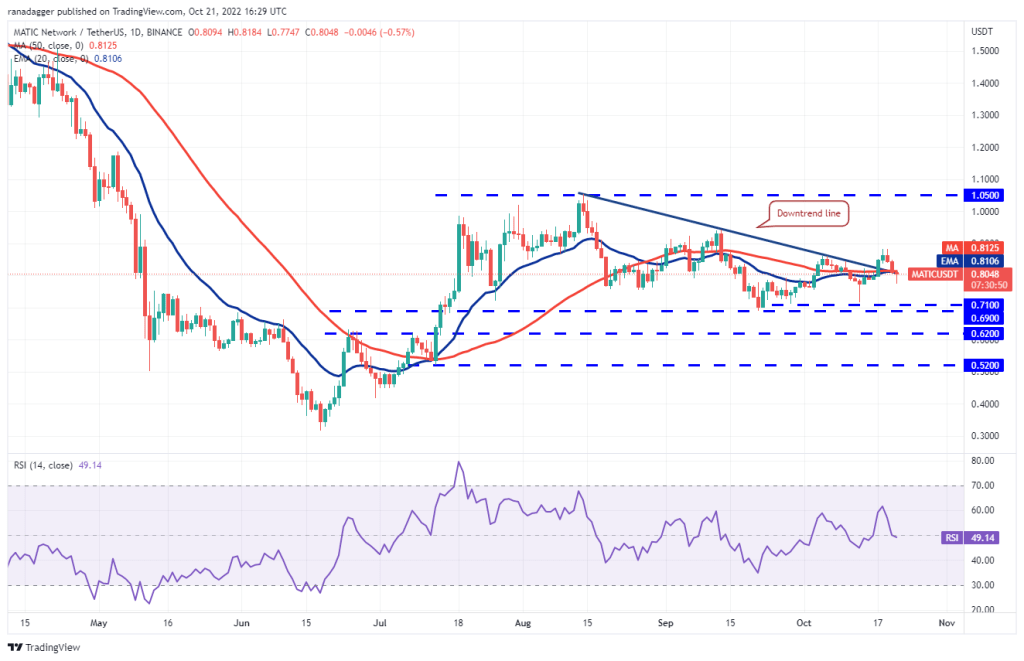
If the price stays below the moving averages, the probability of a drop to the $0.71 to $0.69 support area increases. If the price bounces back from this zone, it will suggest that MATIC will consolidate in a narrower range between $0.69 and $0.88 for a few days. The horizontal moving averages and the RSI just below the midpoint point to a consolidation in the near term. On the other hand, if the price quickly reverses direction and rises above $0.88, it will suggest a change in sentiment from selling on rallies to buying on dips. It is possible for MATIC to rally to $0.94 and then $1.05 later.