
According to one analyst, volatility is approaching. However, he warns that if history repeats itself, traders will likely have to wait until the end of the year. Meanwhile, Bitcoin (BTC) awaited hints as the expectation of an exit was high at the October 24 Wall Street opening.
Hang Seng has dropped the most since 2008
cryptocoin.com As you follow, Bitcoin (BTC) followed an ordinary trading day after hitting a weekly high of $19,700 overnight. Michaël van de Poppe, CEO and founder of Eight trade firm, says production data from the US is much worse than expected. Despite this, Bitcoin has suffered from a declining trajectory.
This has led on-chain analytics resource Material Indicators to suspect that the resistance will remain in place. “Sunday BTC has failed in all attempts to reclaim its 2017 top,” he said, summarizing the most recent 24-hour price action according to private trading indicators. In this context, he made the following statement:
The change in the trajectory of Trend Precognition’s A1 Slope Line after the D and W closing indicates a loss of momentum. The price is currently fixed between the 50-Day MA and the trendline awaiting the TradFi opening.
Meanwhile, Van de Poppe set selling levels at $19,600 and $20,700. He also added that US dollar and US bond yields were ‘showing some weakness’. Popular trading account Game of Trades noted:
The upward momentum in bond yields is declining. The last time this happened, the markets went into a big run.
However, Hong Kong Hang Seng saw its biggest daily drop since the Lehman Brothers boom in 2008. This gave clearer signs of volatility during the day, especially in Asia.
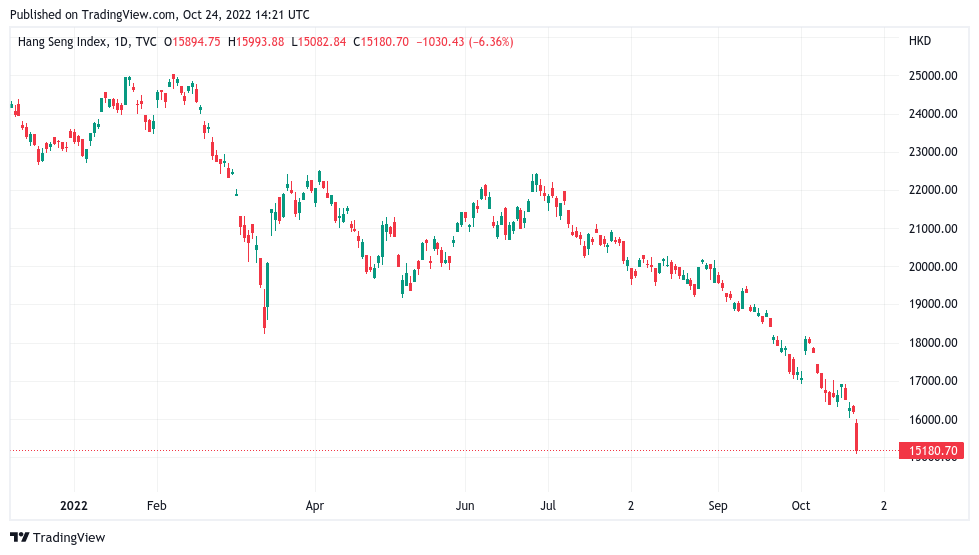 Hang Seng Index 1-day candlestick chart / Source: TradingView
Game of Trades likewise evaluated the S&P 500 as a potential source of ‘big moves’ with increased volatility.
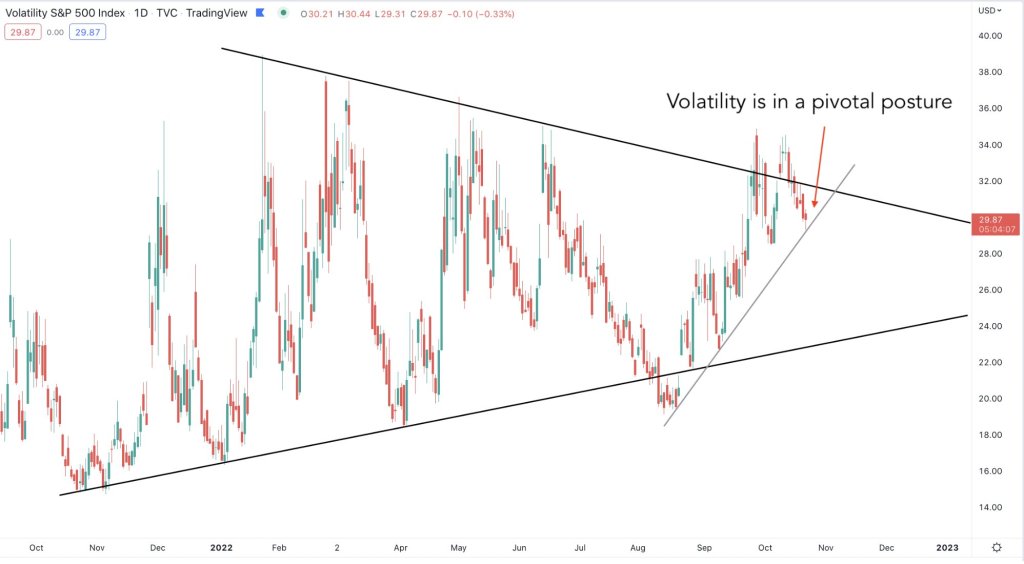 S&P 500 volatility caption chart / Source: Game of Trades/Twitter
“Big sweeping move” could be months off for Bitcoin
For Bitcoin, volatility is likely to take a long time as a classic indicator only gives signals that have been seen a few times before. As DecenTrader co-founder Filbfilb noted, Bitcoin’s Bollinger Bands continue to contract on weekly timeframes, reaching rare levels. He shared the following for his Twitter followers:
The result of each example is clearly one big broad move. The funny part is that in each of the examples, BTC spent 6-8 weeks tightening it further from the level of breadth we are currently at before a major expansion move. So I’m afraid there’s a good chance this thing will go even further.
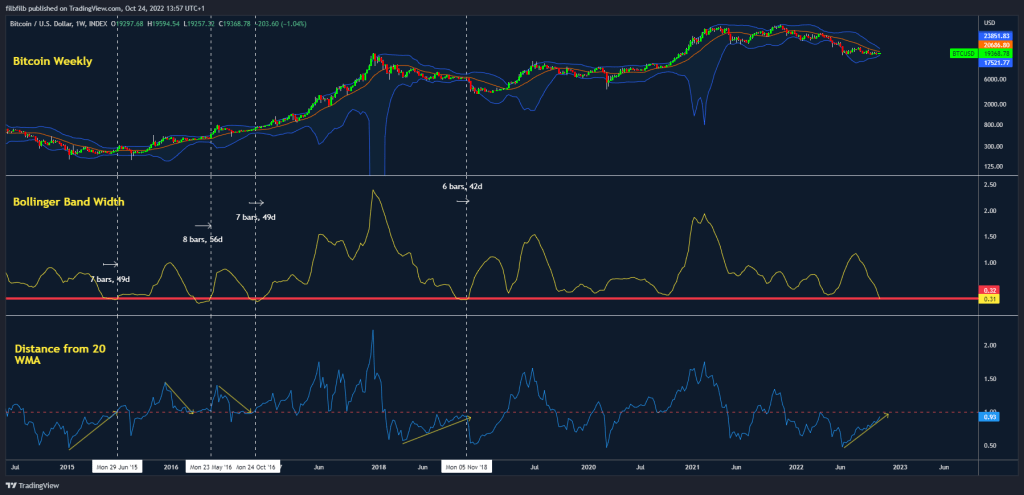 BTC comparison charts / Source: Filbfilb/Twitter
Charles Edwards, founder of asset manager Capriole, added that up or down, Bitcoin’s current increasing correlation with gold is something to consider. To this end, he made the following statement alongside a comparative chart of previous periods:
Bitcoin bottoms often align with gold with a high correlation. We have this today. Much better when Bitcoin is associated with gold. It is unchained.
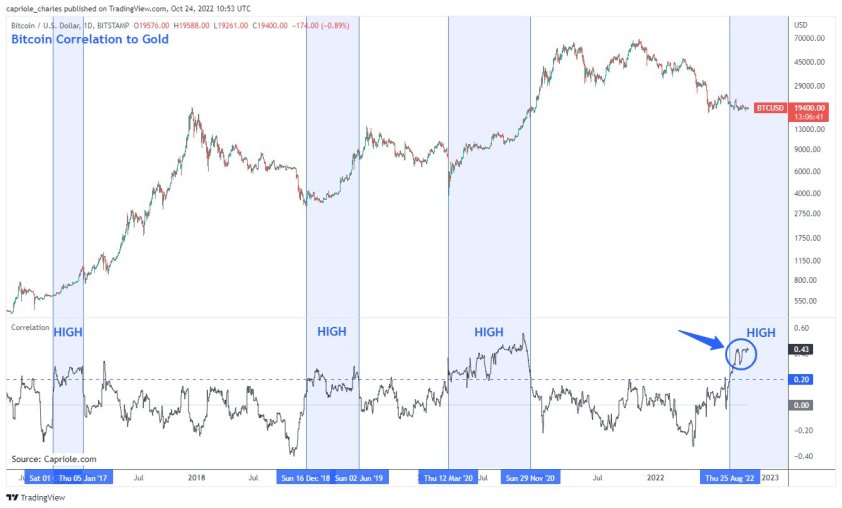 BTC vs. gold correlation explanatory chart / Source: Charles Edwards/Twitter