ConstitutionDAO (PEOPLE) was the week’s top gainer, rising 27.30% amid the FTX crisis. On the red board is FTT, the exchange’s native token, down 86%. In this article, accompanied by analyst Valdrin Tahiri, let’s take a look at the technical situation of the altcoin projects that lost the most during the week of November 4-11.
- FTX Token (FTT) -86%
- Curve DAO Token (CRV) -32.1%
- Arweave (AR) -31.98%
- Aptos (APT) -30.28%
- Huobi Token (HT) -30.28%
Here are 5 altcoins that saw historic bottoms in the FTX crash
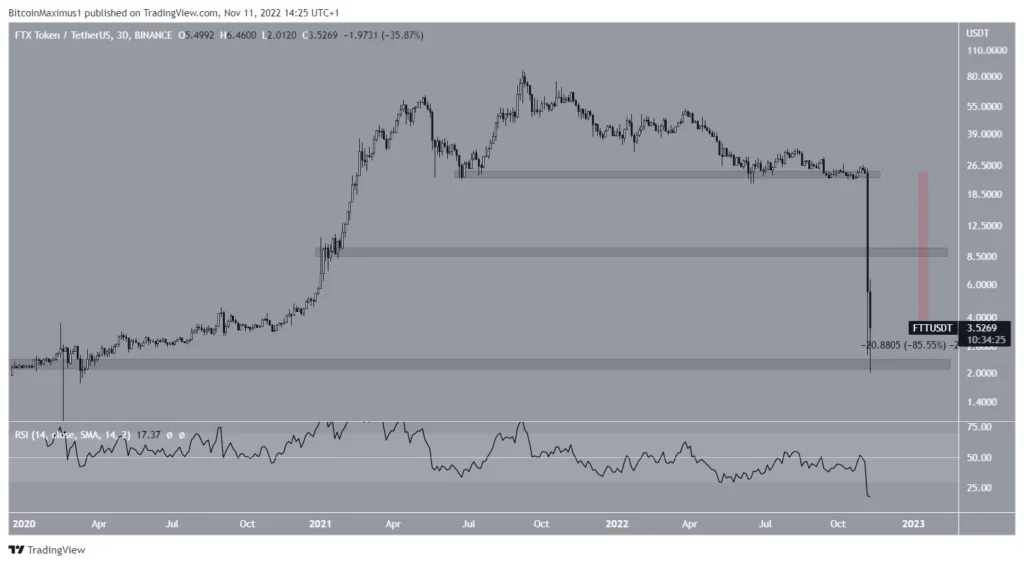
FTT price lost the $24 support on Nov. He had been protecting this area since June 2021. The breakout was rapid, and it melted down to $2.01 three days later. Later, the price bounced off the recent support area at $2.20. Despite the bounce, technical indicators are showing a decline. The RSI is declining, below 50 and in the oversold zone. So far, the FTT price has lost 86%. According to the analyst, a break below the $2.20 support area will take FTT price to all-time lows. Conversely, if the bounce continues, $9 will be the next resistance.
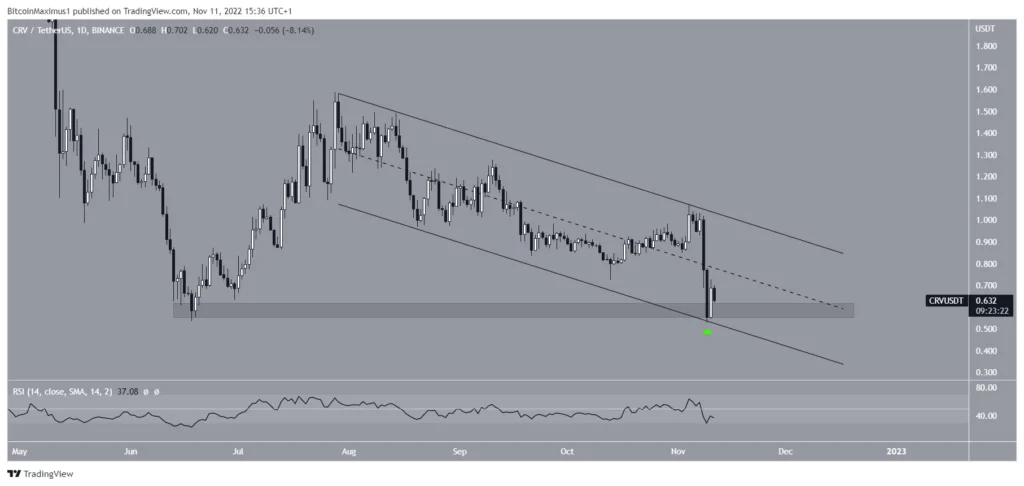
CRV price forms double bottom formation
The CRV has been falling within a descending parallel channel since July 28. The downward move hit the lowest level at $0.52 on November 9th. The bottom zone served to confirm the $0.42 horizontal support area and the support line of the channel. Additionally, it is possible for the CRV price to form a double bottom, which is considered a bullish pattern. According to the analyst, there will be a chance to gain upward momentum from this region.
However, the daily RSI is falling below 50. This casts doubt on the possibility of an up move and a breakout of the channel. So, whether CRV price breaks out of the channel or falls below the $0.42 area will determine the direction of the future trend.
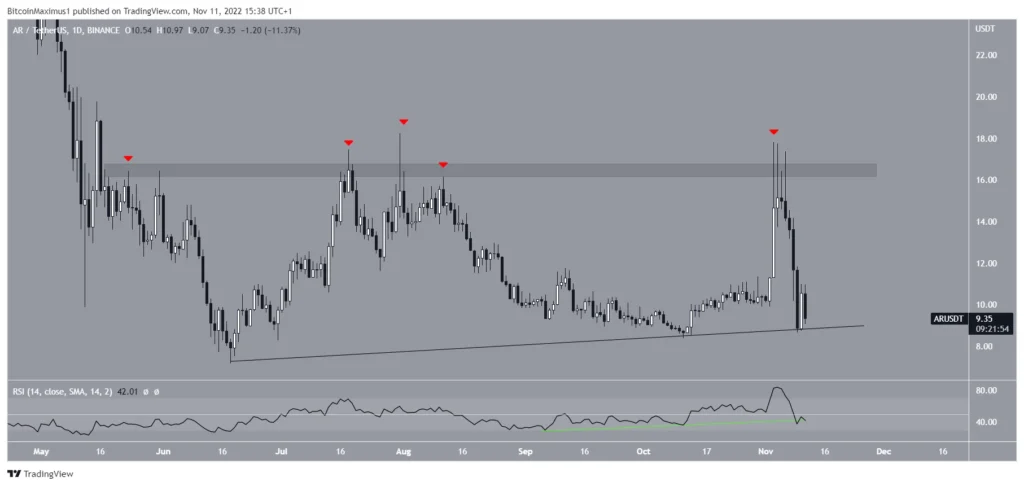
AR price reaches cross support level
AR price has been following an ascending support line since June 18. During this time, the $16.50 area acted as resistance and caused five rejections (red). It reached the AR support line on November 10 and started a slight bounce in the last 24 hours. However, the daily RSI risks breaking out of the uptrend trendline. If the daily RSI breaks out of the uptrend line (green), a breakout from the support area is expected.
APE price failed to recover from altcoin market crash
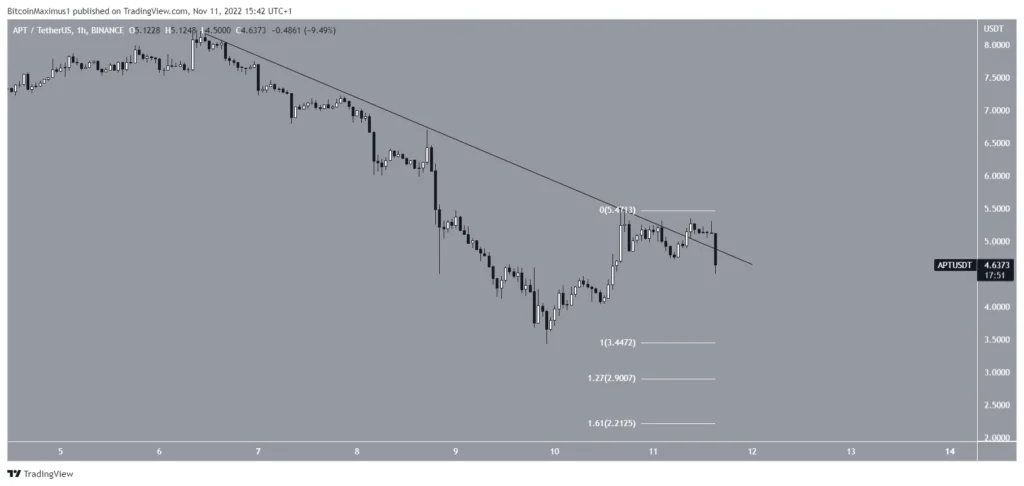
APT apparently broke out of a descending resistance line that has existed since November 6 on November 11. However, it was unable to sustain its upward movement and soon fell below the line. Such divergences are often followed by significant downward movements. If the downside continues, the closest support levels will be $2.90 and $2.21, formed by the 1.27 and 1.61 external Fib retracement support levels (white). Conversely, retracement of the line would be a bullish indicator.
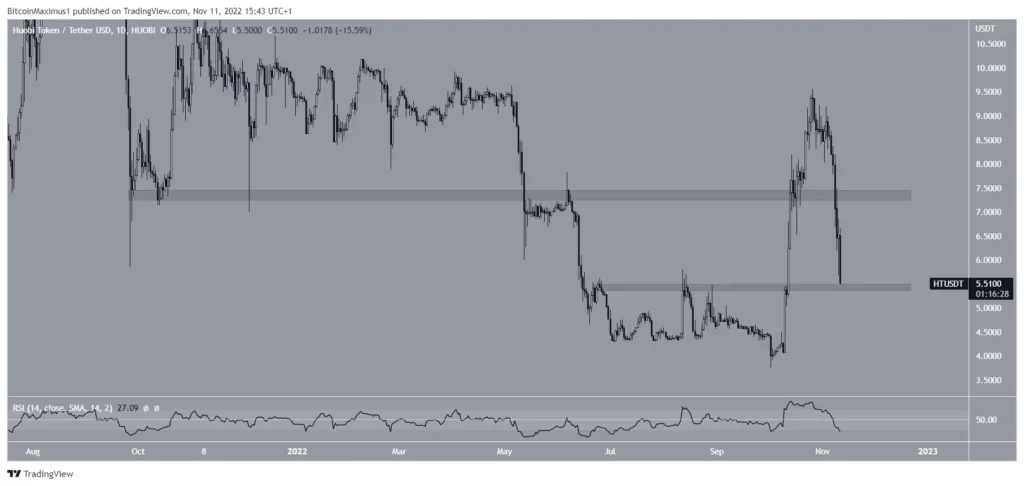
HT price melts amid altcoin bear market
cryptocoin.com As you follow, the HT price has been falling since it reached $9.57 on October 26. The downward move reached $5.50 on Nov. 11. Besides, there was a break below the $7.40 area, which is currently expected to act as a resistance. The closest support area is at $5.50. Therefore, the most likely scenario suggests that HT will form a range between these two levels.