
According to technical analyst Ross J Burland, the gold price is facing a weekly resistance that supports the downtrend. Therefore, the analyst notes that there are expectations of a break below $1,700. Also, the analyst says that a healthy correction target on the hourly charts for the opening sessions is $1,750.
Rising bond yields continue to put pressure on gold price
Gold closed Friday lower as dollar and bond yields rose. The yellow metal continued its decline on Monday, dropping below $1,750. However, further declines are possible for the precious metal, according to the charts. That’s because rising bond yields continue to put pressure on the noninterest-paying metal. cryptocoin.comFed officials, on the other hand, argue for the need to continue raising interest rates to rein in still-high inflation.

That puts the Fed minutes of the November meeting, due Wednesday, into focus, as they can provide new insights into how officials expect to ultimately raise interest rates. Futures traders are pricing in an increase in the federal funds rate to 5.06% by June from the current 3.83%.
Terminal interest rate expectations fell to 4.89% on Tuesday. Meanwhile, markets expect the Fed to raise interest rates by another 50 basis points at its December 13-14 meeting. However, the minutes will shed light on the FOMC’s negotiations on the expected decline in the rate of interest rate hikes. But more importantly, policymakers will stress that the final rate will likely be higher than previous expectations as the labor market remains extremely tight.
Technical analysis: Golden bears move and focus $1,720
Technical analyst Ross J Burland analyzes the technical outlook for gold on the charts below.
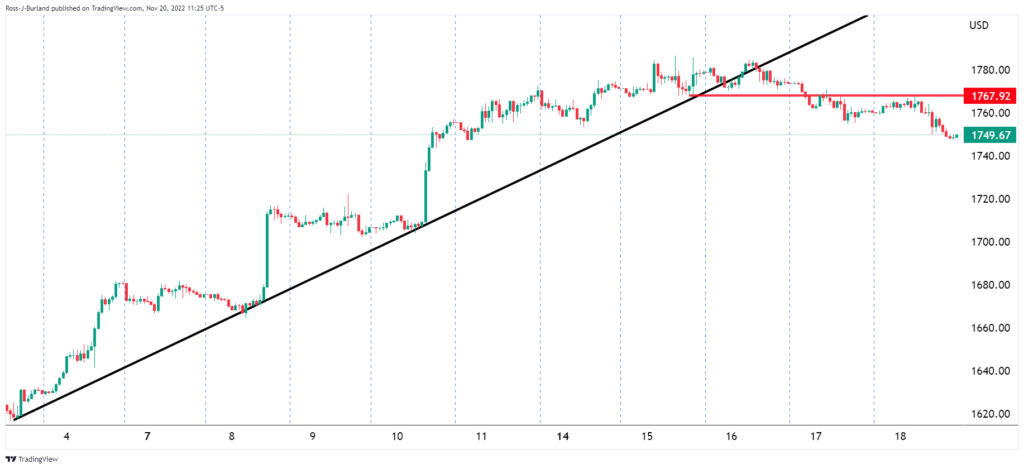 Gold price 1-hour chart-1
The yellow metal is under pressure below its previous structure and behind the hourly trend line that broke mid-week.
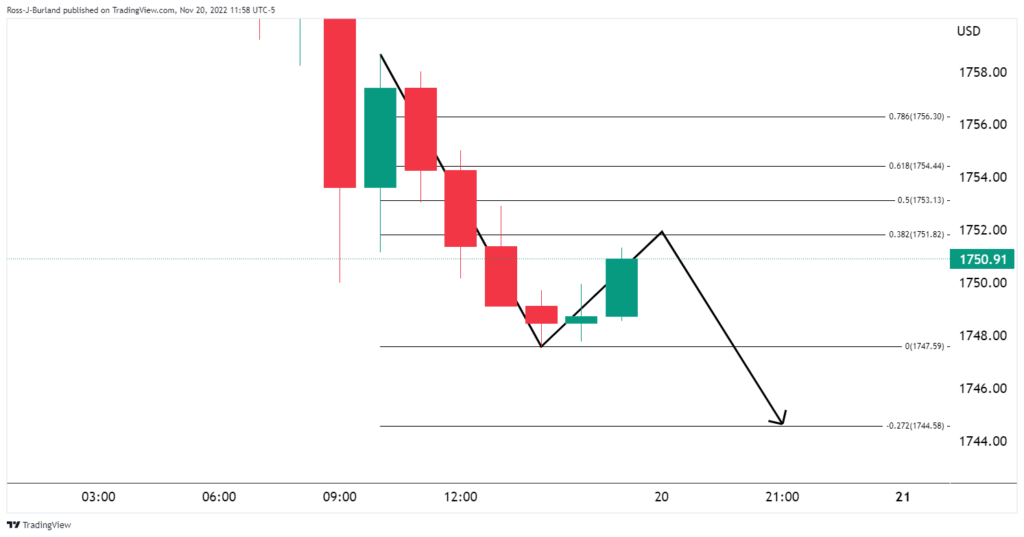 Gold price 1-hour chart-2
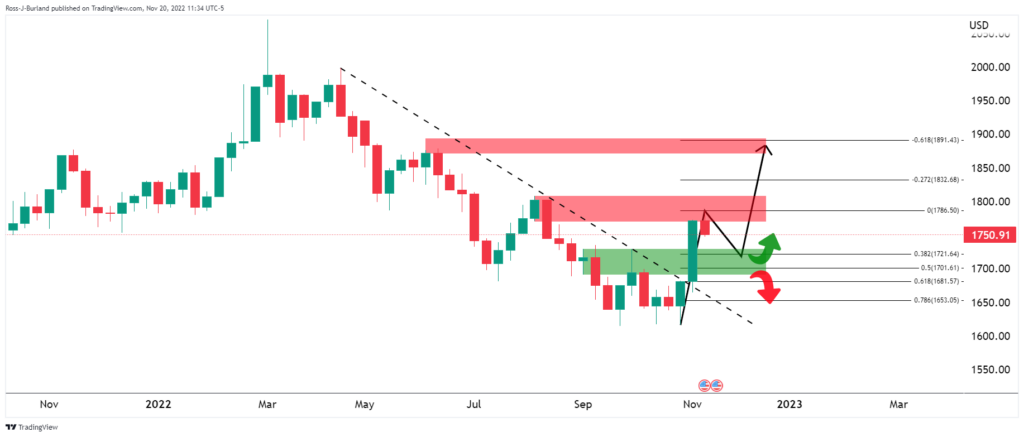
Still, a deeper correction to open at $1,750 is possible this week at the 38.2% Fibonacci cross.
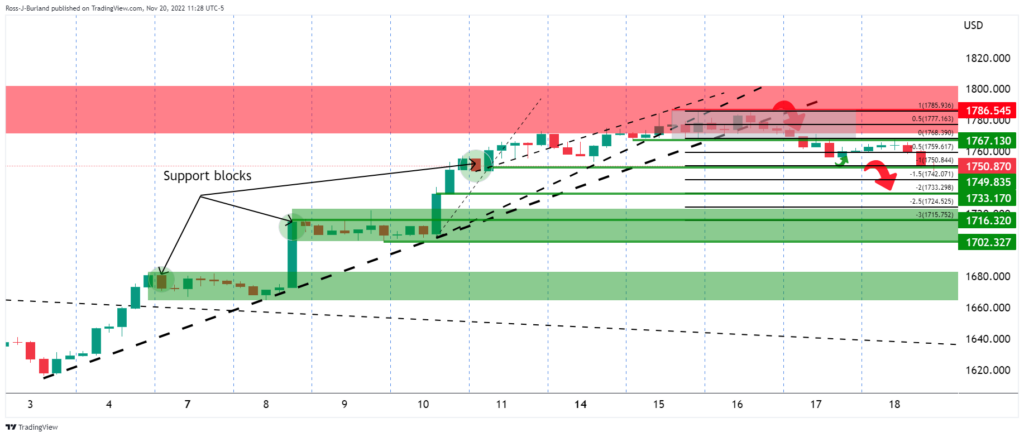 Gold price 4 hour chart
Looking forward, the support blocks of the 4-hour chart will be on the bearish path. Also, the gold price stays at the back of the daily trend.
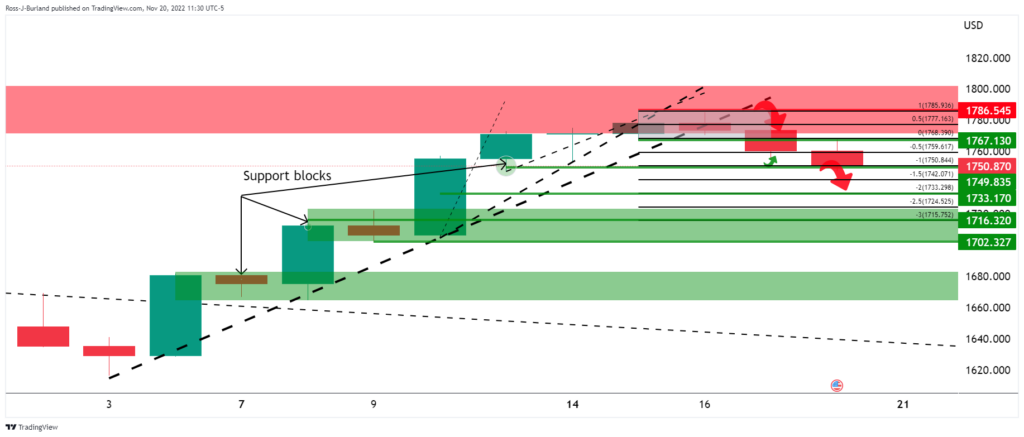 Gold price daily chart
Weekly resistance supports downside bias in anticipation of a break below $1,700.
 Gold prices weekly chart


