
Bitcoin has been trading in a narrow range since November 24. Because traders are unsure of the next directional move. However, traders with a long-term view can basically try to accumulate strong altcoins in a few tranches. Cryptos that get the market out of the bear phase generally tend to perform well when the next bull market starts. Analyst Rakesh Upadhyay shares altcoin projects that are trying to initiate an upward move in the short term…
General status of Bitcoin and altcoin projects
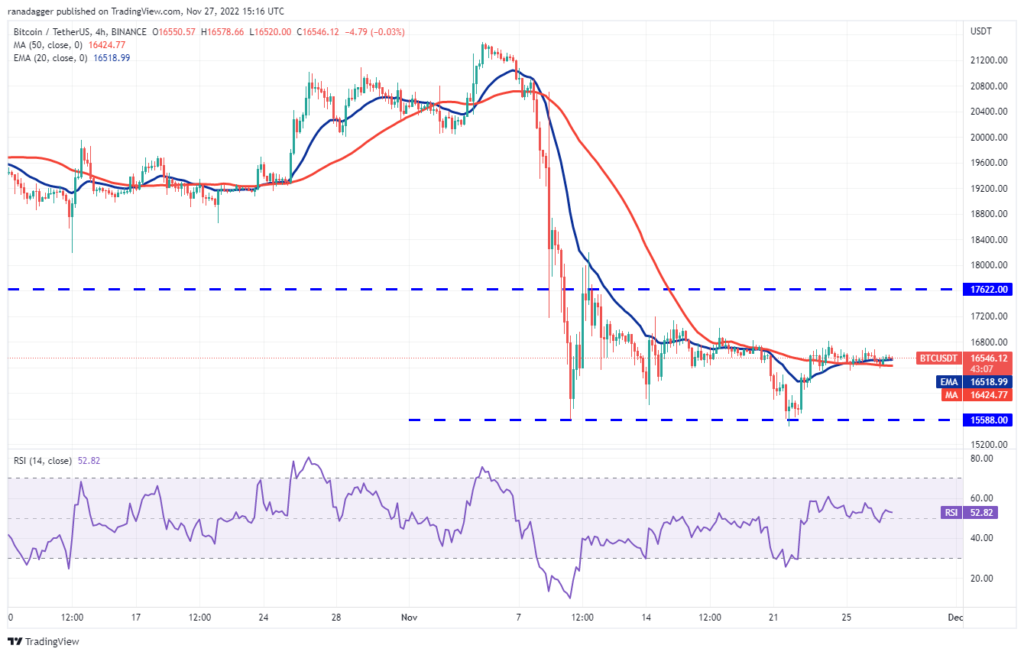
cryptocoin.com As we have reported, Bitcoin has been consolidating between $15,588 and $17,622 for the past few days. The relative strength index (RSI) has formed a bullish divergence suggesting that selling pressure may be easing. The relief rally could face stiff resistance in the region between the 20-day exponential moving average ($17,065) and $17,622. If the price drops from the general zone, the BTC/USDT pair could extend its stay in the range for a while.
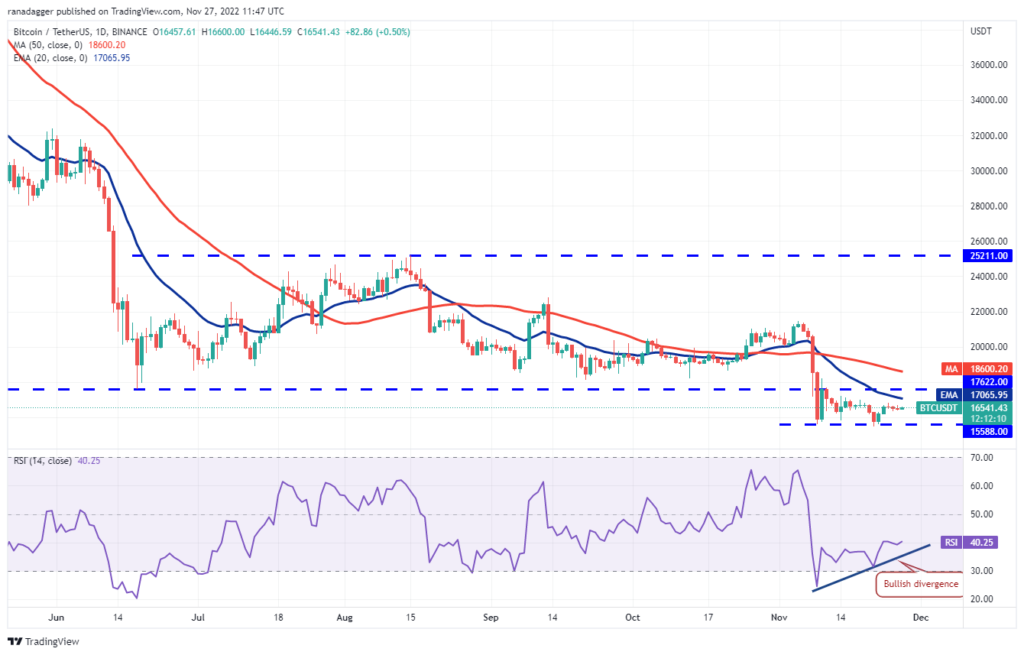
According to the analyst, the 50-day simple moving average ($18,600) could act as a minor hurdle, but if surpassed, the up move could reach the psychological level of $20,000. Alternatively, if the price drops from overhead resistance and sinks below $15,588, it could signal a resumption of the downtrend. The pair could decline to $13,554 later.
What’s next for the popular meme coin DOGE?
Dogecoin (DOGE) broke above the overhead resistance of $0.09 on Nov. 25. However, the bears pushed the price below the November 26 level. Buyers regrouped and pushed the price above the 38.2 percent Fibonacci retracement level of $0.10 on Nov. 27. The bears might try to stop the recovery around $0.10 again. However, if the bulls do not allow the price to drop below $0.09, the DOGE/USDT pair could gain momentum. It could rally towards the 61.8% Fibonacci retracement level of $0.12. If this level also scales, the pair could continue its upward move towards $0.16.
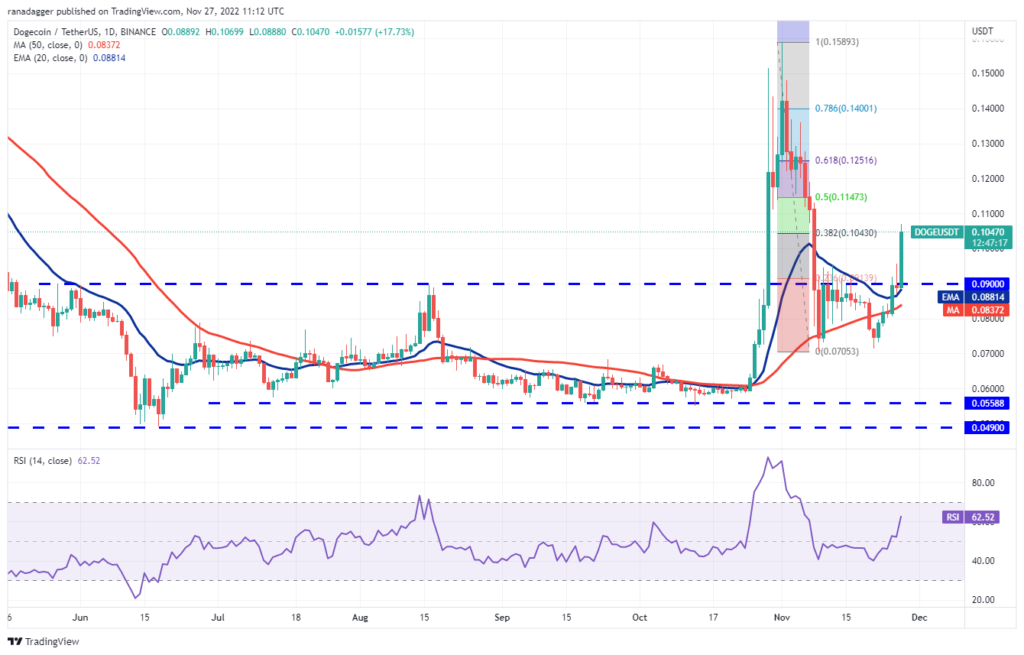
On the other hand, if the price turns down from the current level, it would suggest that the bears will continue to view the rallies as a selling opportunity. The pair could decline to $0.09 later. If this support leads, the 50-day SMA ($0.08) could be challenged. Buyers pushed the price above the range that indicated the start of the upward move. The strong rally pushes the RSI to overbought levels, signaling a minor correction or consolidation in the near term.
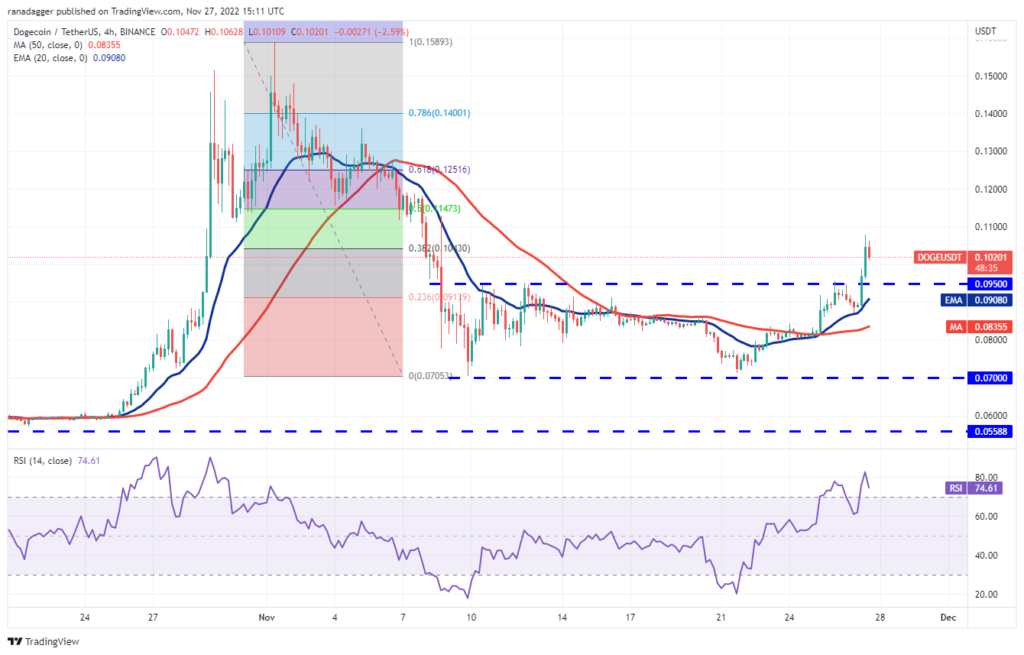
If the price drops from the 38.2 percent Fibonacci retracement at $0.10 but bounces back from the breakout level, this will indicate that sentiment has turned positive and traders are buying on the dips. The bulls will then try to continue the uptrend. According to the analyst, the target target for exiting the range is $0.12. This positive view may be invalidated in the near term if the price goes down and re-ranges. The pair could then drop to the 50-SMA.
The altcoin that stood out with its rise this week: Litecoin
A break above the overhead resistance at $75 in Litecoin is the first indication of a potential trend change. The bears tried to push the price below $75 and trap the aggressive bulls, but the buyers held their ground. The bulls will attempt to push the price above the overhead resistance of $84. If they are successful, it could signal the start of a new uptrend. The rising 20-day EMA ($67) and the RSI near the overbought zone suggest the path of least resistance is to the upside. The LTC/USDT pair could then rise towards the $104 target.
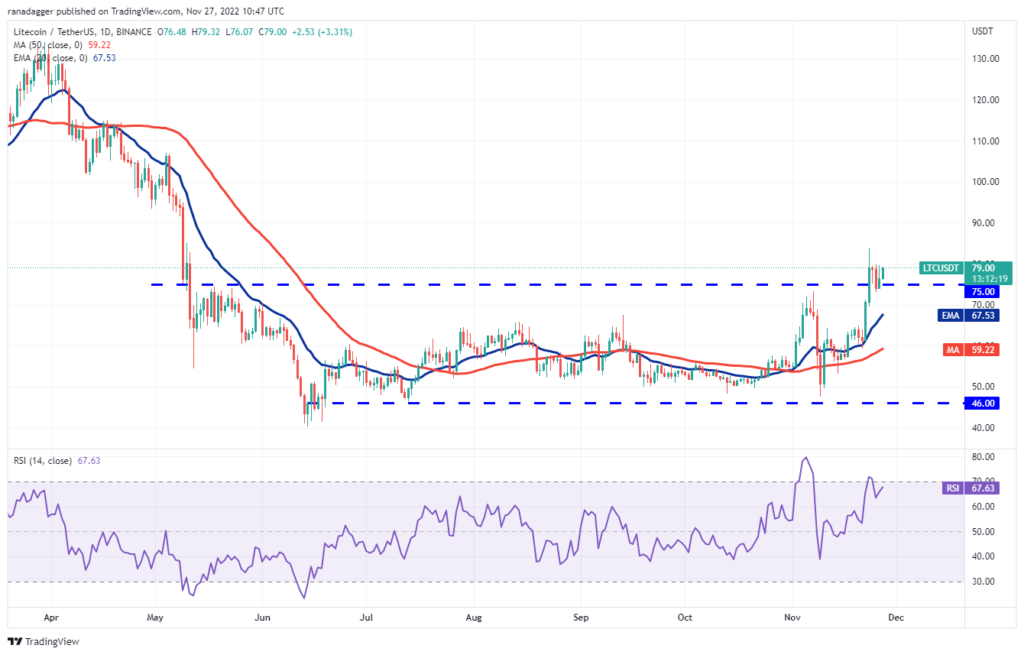
Conversely, if the price declines from $84, the pair could slide into the $73 to $75 support zone. If this zone breaks down, the pair could slide to the 20-day EMA. The bears will have to push the price below this support to trap the aggressive bulls. If the price bounces back from the 20-day EMA, the bulls will attempt to push the pair back above $84 and start the uptrend. The 4-hour chart shows that the price broke and closed below the 20-EMA, but the bears were unable to leverage this advantage. The bulls bought this dip and pushed the price above the 20-EMA.
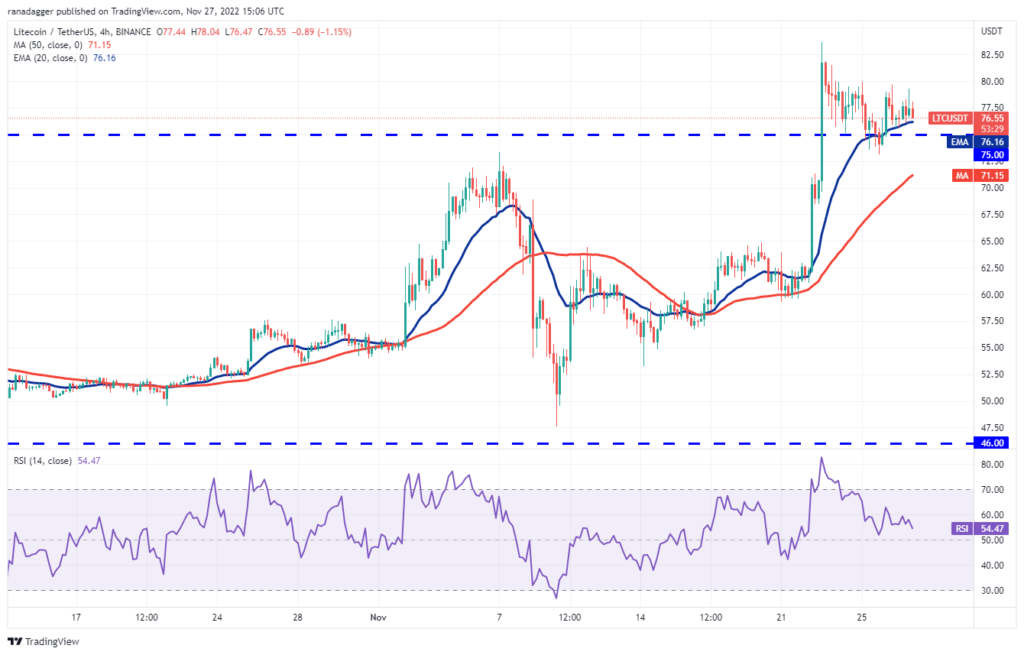
Both moving averages are rising and the RSI is just above the midpoint, suggesting that buyers have a slight advantage. There is a minor resistance at $80, but if the bulls push the price above this level, the pair could rally to $84. According to the analyst, the pair could try to rise to $96 later. If the bears want to invalidate this view in the short term, they will have to push the pair below $73.
These levels are important for Chainlink
Chainlink (LINK) has been fluctuating between $5.50 and $9.50 for the past few weeks. A strong rebound from support at $5.50 on Nov. 21 indicates that the bulls are aggressively buying dips to this level. The 20-day EMA ($6.74) has started to rise and the RSI has rallied into the positive territory, pointing to a minor advantage for the bulls. If the price stays above the 50-day SMA ($7.15), the probability of a rise to $8.50 and then $9.50 increases.
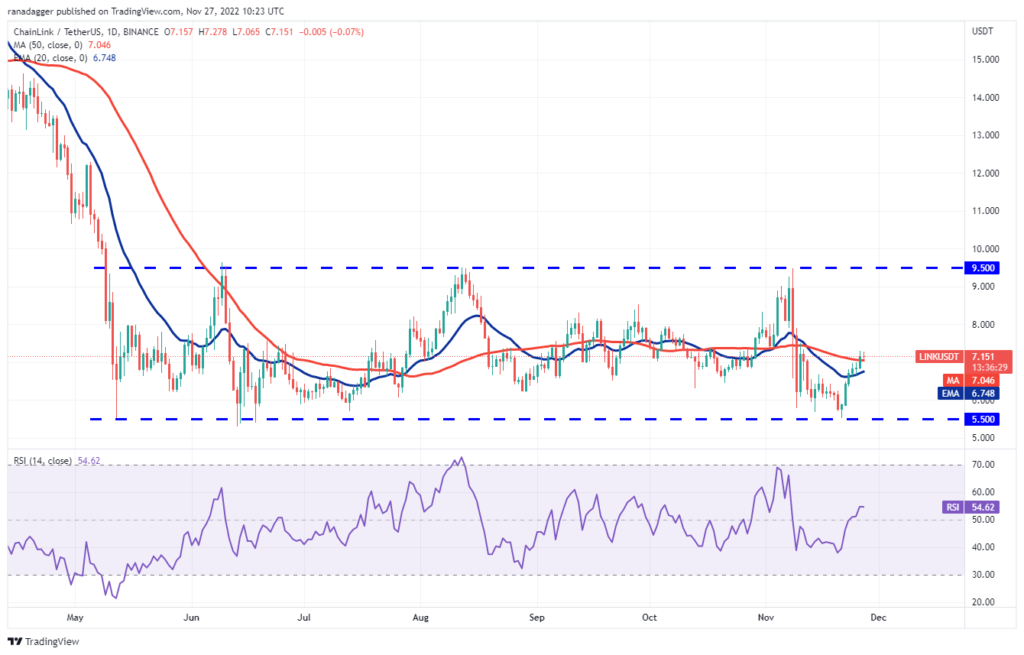
Contrary to this assumption, if the price turns down and breaks below the 20-day EMA, it will suggest that the bears are active at higher levels. The LINK/USDT pair could then drop back to the $5.50 support and consolidate near it for a few more days. The strong rebound at $5.50 is approaching the overhead resistance at $7.50.
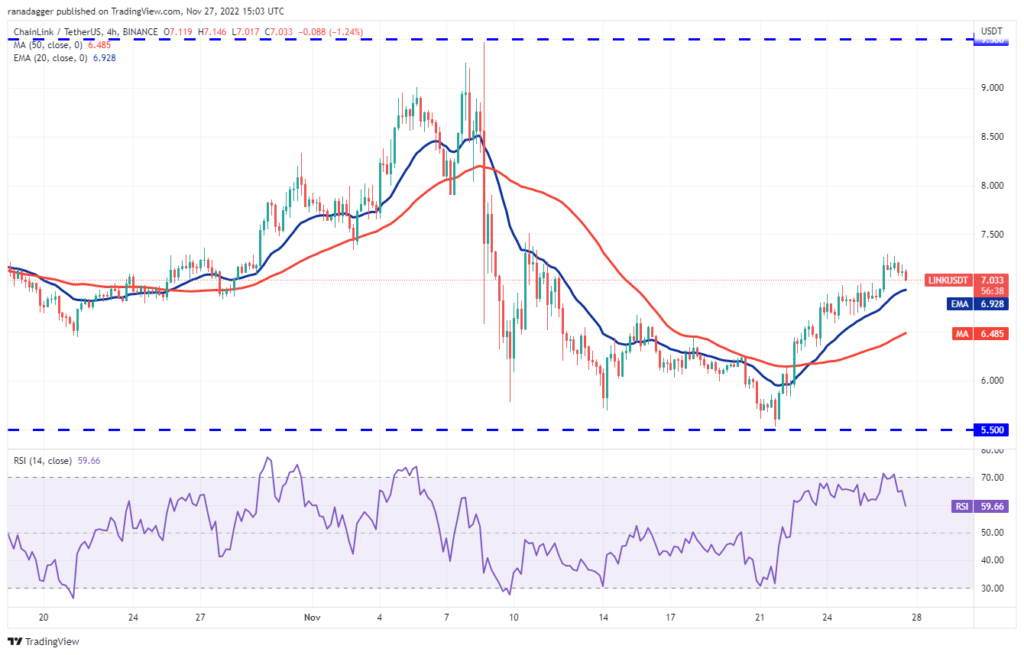
If the price turns down from this level and breaks below the 20-EMA, the pair could drop to the 50-SMA. A break below this support could hold the pair between $5.50 and $7.50 for a while. Another possibility is for the price to drop from $7.50 but bounce back from the 20-EMA. The bulls will then try to push the price back above $7.50 and start the upward walk towards $8.50.
Last altcoin on the list: APE
Apecoin (APE) has been consolidating in a wide range between $3 and $7.80 for the past few months. The bears tried to push the price below the support of the range but failed to sustain the lower levels. This indicates strong demand at lower levels. Continuous buying pushed the price above the 20-day EMA ($3.47) on Nov. 26, indicating that the bulls are making a comeback. There is a minor resistance at the 50-day SMA ($4.06), but if the bulls break this hurdle, the APE/USDT pair could rise to the downtrend line.
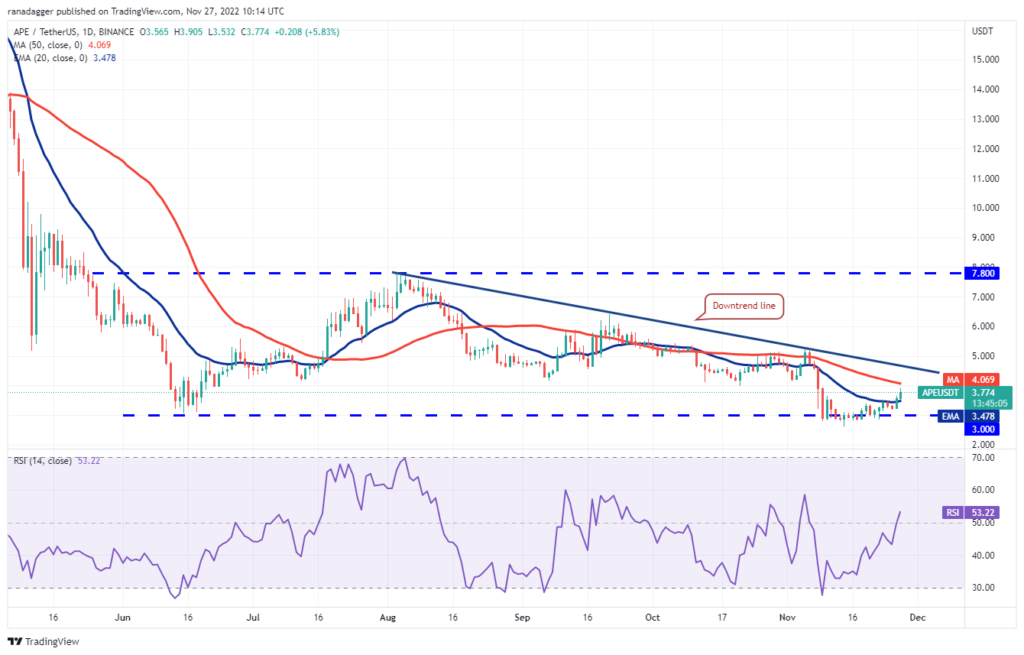
If the price turns down from the downtrend line, the pair could drop to the 20-day EMA. If the pair rebounds from this level, it will show that the sentiment has shifted from selling on rallies to buying on dips. This could increase the likelihood of a break above the downtrend line. According to the analyst, the pair could climb to $6 later. On the contrary, if the price turns down from the downtrend line and breaks below the 20-day EMA, the pair could slide back to the strong support at $3.
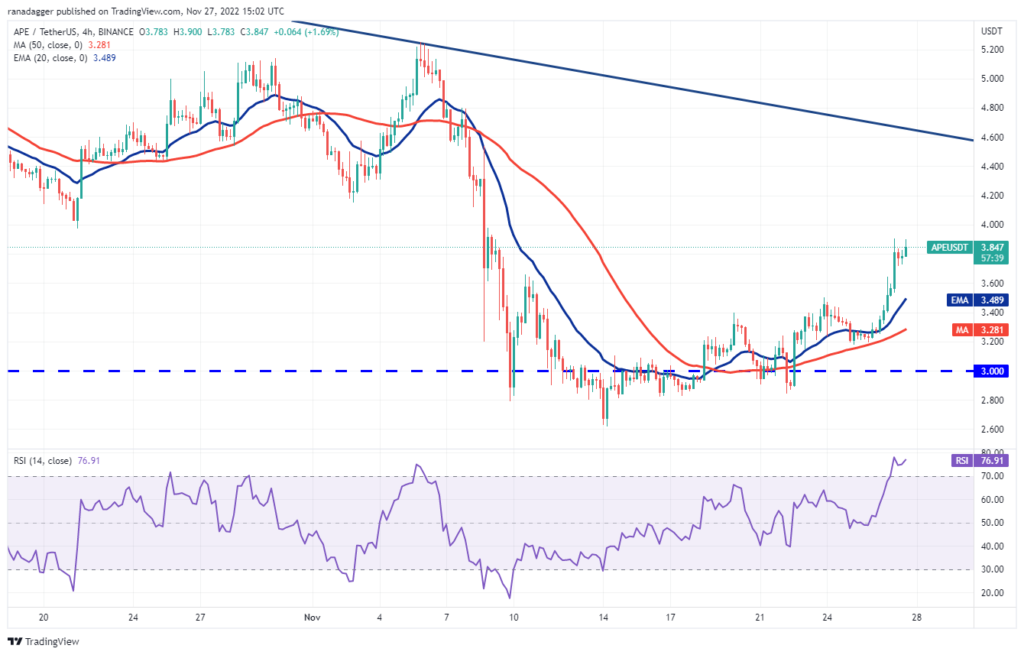
The moving averages on the 4-hour chart have started to rise and the RSI has jumped into the overbought zone. This shows that the bulls have a slight advantage. Recovery may face resistance at $4. However, if the bulls do not allow the price to fall below the moving averages, the upward move could reach the downtrend line. This positive view may be invalidated in the near term if the price turns down and falls below the 50-SMA. Such a move would indicate that the bears continue to sell in the rallies. The pair may drop to $3 later.