U.S. stock markets ignored the higher-than-expected labor data on Dec. It rebounded sharply from intraday lows. This shows that market watchers believe the Fed will not be able to change its interest rate stance due to the latest employment data. On the other hand, the FTX crisis has broken the positive correlation between US stock markets and Bitcoin. However, the recent strength in stocks shows risk appetite. According to some, this could be favorable for the cryptocurrency space and attract bottom buyers. In this article, we will share altcoin projects that are ready to rise, according to analyst Rakesh Upadhyay.
Before altcoin analysis: What’s the latest on BTC/USDT?
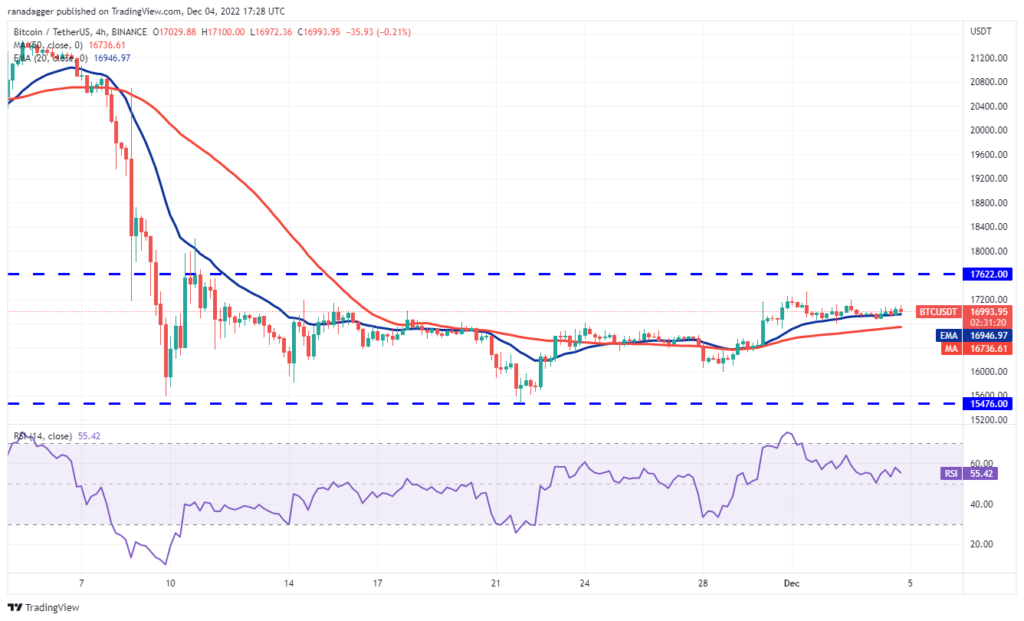
cryptocoin.com As we have reported, Bitcoin has been trading around $ 16,963 for the last three days. This marks a tough fight between bulls and bears to gain the upper hand. The biggest hurdle for Upside buyers is $17,622. If the bulls push the price above this level, it will suggest that the downtrend may end.
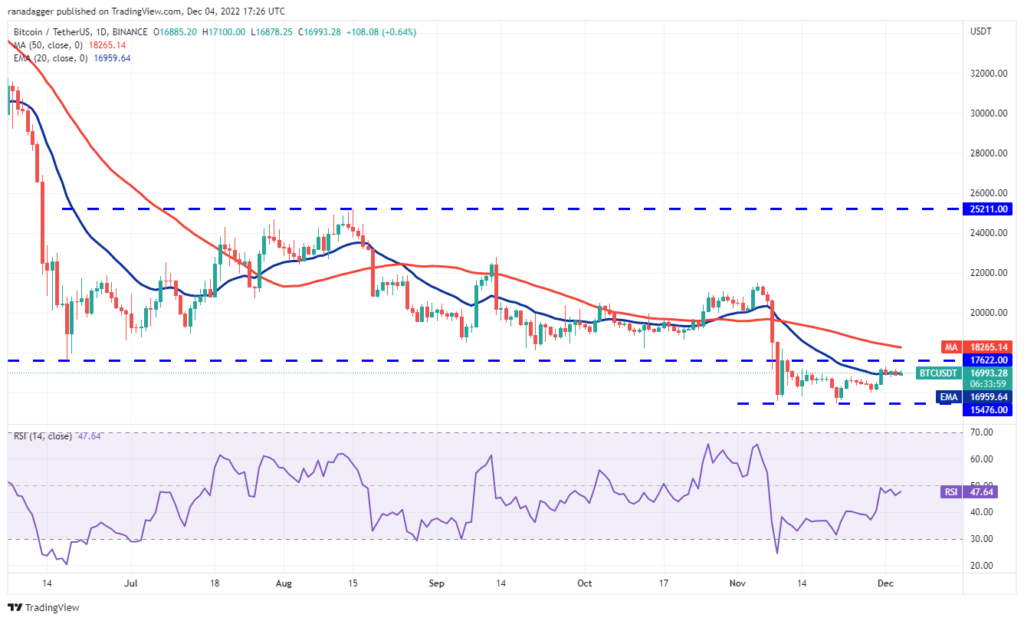
The BTC/USDT pair can then race up to the psychological level of $20,000. This level could act as a resistance again, but if it is exceeded, the pair could rally to $21,500. Conversely, if the price drops from $17,622 and breaks below the 20-day EMA, this will indicate that the bears have not given up yet. The pair could then consolidate in a wide range between $15,476 and $17,622.
What are the prospects for the popular altcoin TON?
According to the analyst, Toncoin (TON) broke above the symmetrical triangle formation on November 30. However, the bulls failed to hold higher as seen from the long wick on the day’s candlestick. However, the bulls are defending the 20-day EMA ($1.73) on the downside. Thus, it showed that purchases were made on the declines. According to the analyst, the upsloping moving averages and RSI in the positive zone point to the advantage for buyers.
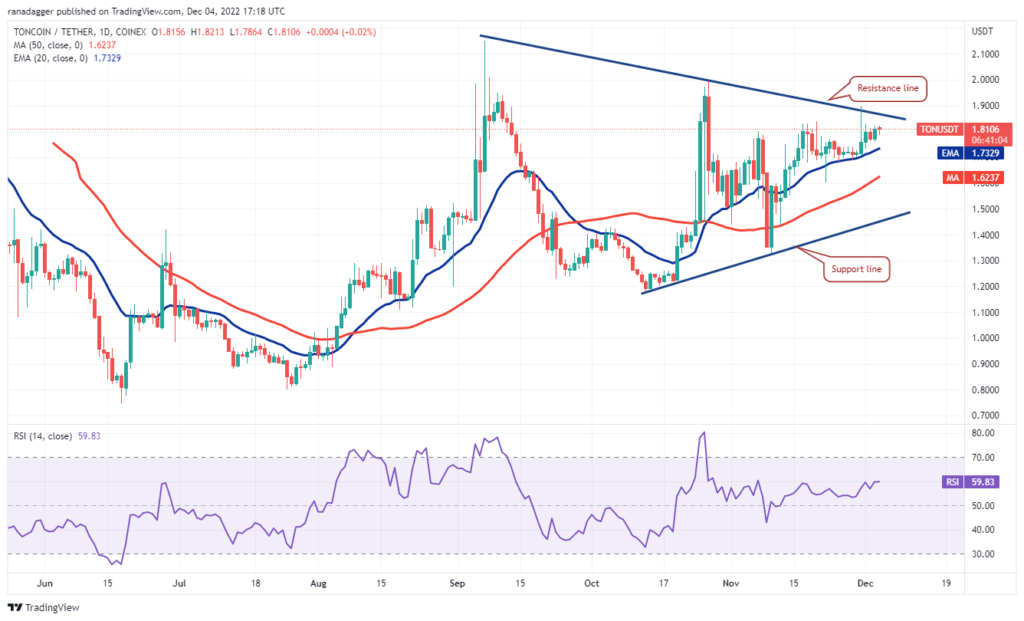
This increases the probability of a breakout above the resistance line of the triangle. If this happens, reception gains momentum. The TON/USDT pair rises to $2.15 and then moves towards its target of $2.87. This positive sentiment may disappear in the near term if the price breaks below the resistance line once again and breaks below the 20-day EMA. This adds to the selling pressure and pulls the pair to the 50-day simple moving average ($1.62) and then to the support line.
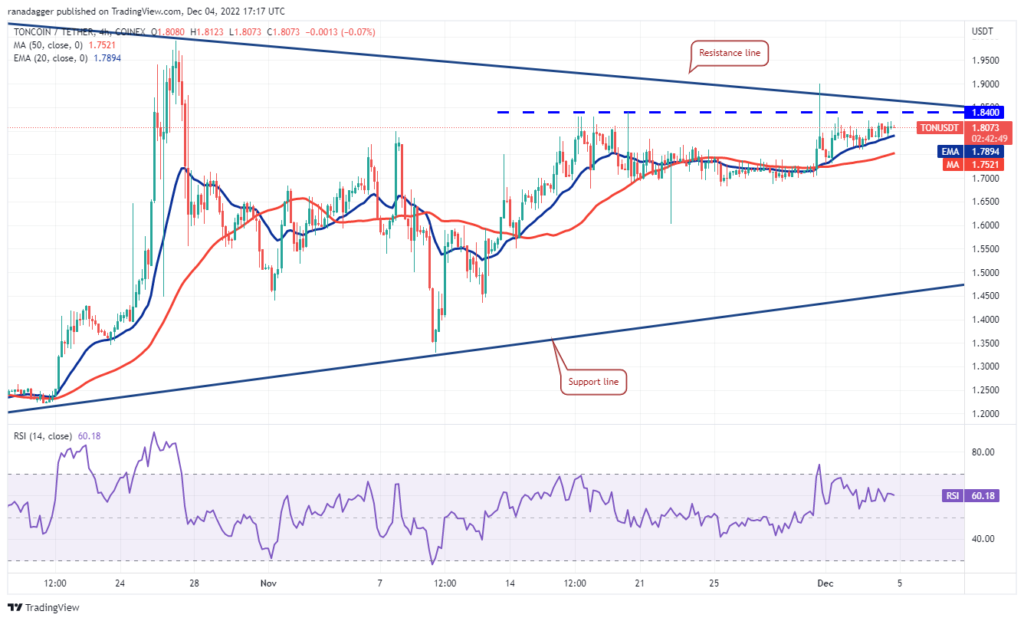
The bulls are buying the dips to the 20-day EMA, while the bears are trying to protect the overhead resistance at $1.84. Price is stuck between the two levels and looks ripe for a range breakout. If the altcoin rises above the general zone between $1.84 and the bearish trendline, it will make the bulls buy more. This could start a fresh rally to $2. An important level to watch on the downside is $1.68 as a break below this will accelerate a drop to the support line.
These levels are important for APE/USDT
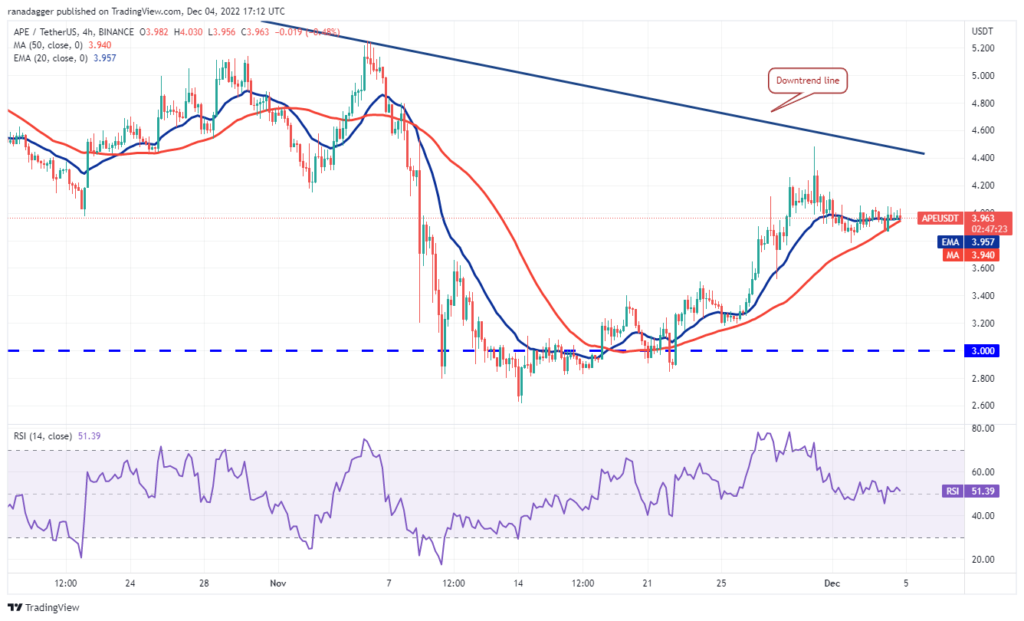
ApeCoin bounced back from the bearish trendline on November 30, but the bulls did not allow the price to drop below the 20-day EMA ($3.73). This is a positive sign as it indicates lower levels of demand. The 20-day EMA is slowly rising and the RSI has jumped into the positive territory. This shows that the bulls are trying to make a comeback. The APE/USDT pair has a chance to gain momentum on a break above the bearish trend line. This opens the doors for a possible rally to $5 and then $6.
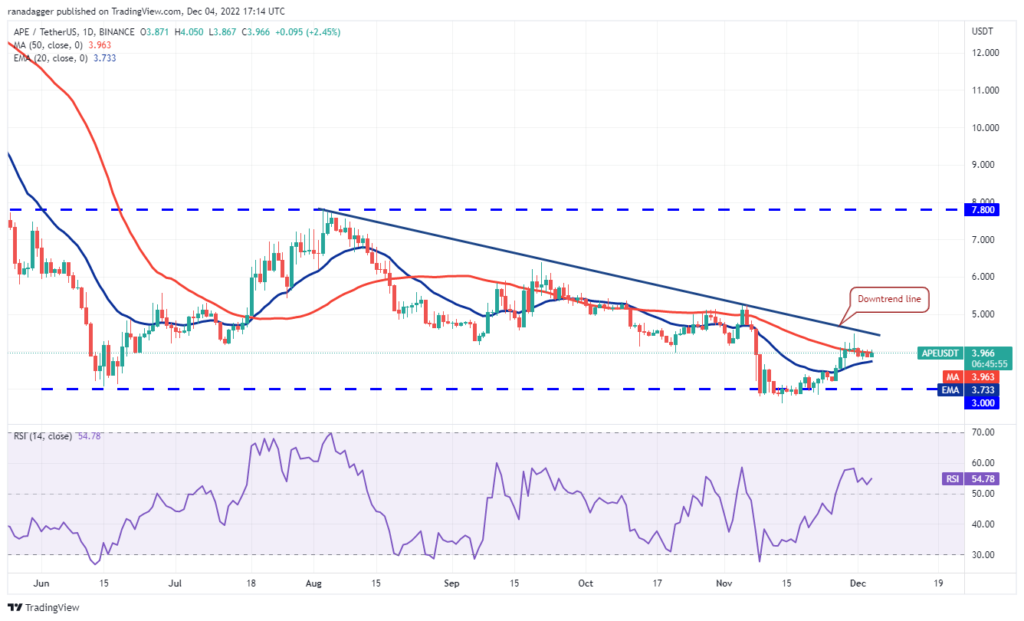
Instead, if the price drops and breaks below the 20-day EMA, it indicates that the bears are active at higher levels. The pair then drops to $3, which is likely to act as a strong support. The situation changes in favor of the bulls if the price rises above $4.05. The pair then rises towards the downtrend line. According to the analyst, if the bears want to gain the upper hand, they will need to break the pair below $3.77. If they do, the drop is likely to extend to $3.50.
Is there a buying opportunity in Trust Wallet Token?
Trust Wallet Token (TWT) gained sharp momentum from the 20-day EMA ($2.07) on Nov 27. The altcoin broke above the $2.45 resistance on Dec. According to the analyst, this shows that the uptrend continues and traders see the dips as a buying opportunity. The bears pose a strong challenge again at $2.73. However, if the bulls overcome this hurdle, the TWT/USDT pair will continue its uptrend. According to Upadhyay, the next stop on the upside is $3, followed by the 3.51 target.
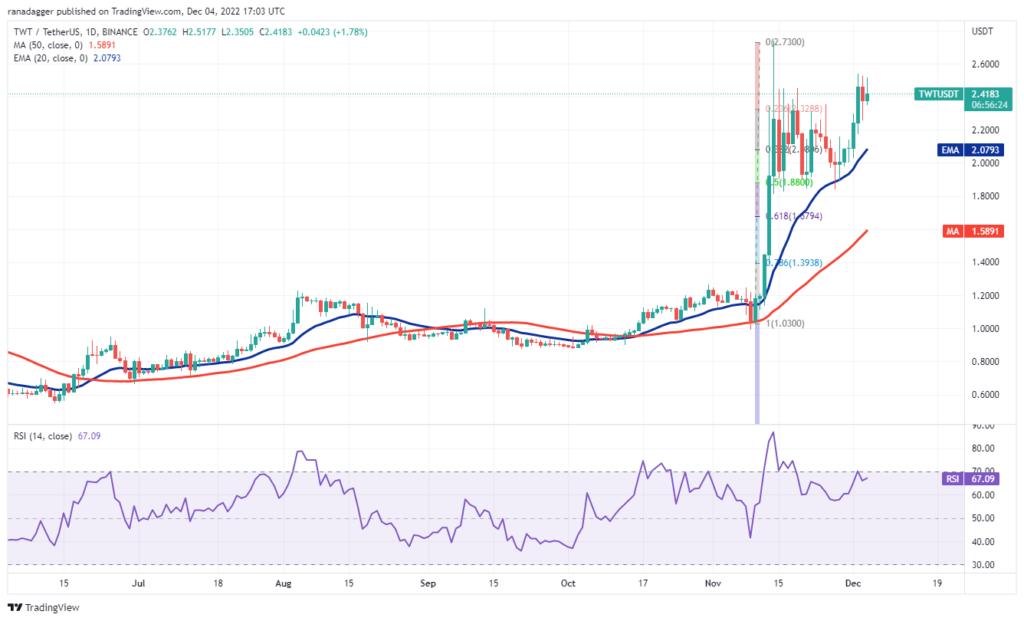
Conversely, if the price declines and dips below $2.25, the pair will slide back to the 20-day EMA. According to the analyst, this remains the key level to watch on the downside. Because a break below this will pull the pair to $1.81. A bounce from this level indicates that the pair could consolidate between $1.81 and $2.54 for a few days.
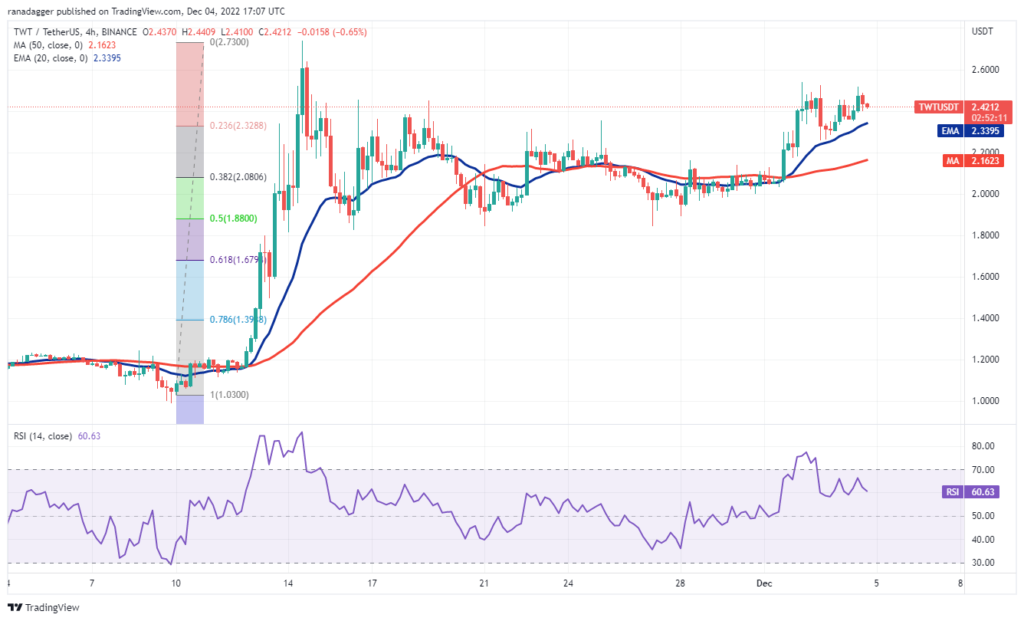
The bulls will try to push the price above the overhead resistance zone between $2.54 and $2.73. If they are successful, the pair starts the next leg of the uptrend. However, if the price drops and dips below the 20-EMA, the bullish momentum weakens. The pair then slides to the 50-day simple moving average (SMA). The pair remains range-bound for a while before starting its next move.
Last coin on the list: Aave
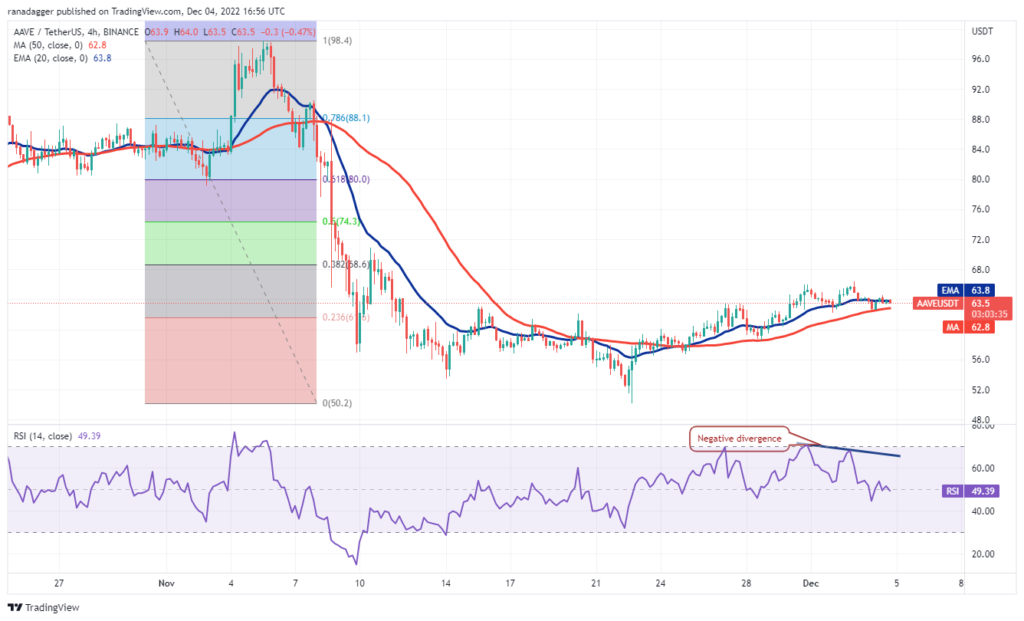
Aave has risen sharply from the psychological support of $50. It broke above the 20-day EMA ($63). Buyers are currently trying to strengthen their position by turning the 20-day EMA to support. The bears are attempting to protect the 32.8% Fibonacci retracement level of $68. The 20-day EMA has flattened and the RSI is near the midpoint. According to the analyst, this indicates that the bears are starting to lose control. If buyers push the price above $68, the AAVE/USDT pair will push higher to the 50-day SMA ($71) and then to $80. Conversely, if the price bounces back and dips below the 20-day EMA, the pair will slide back to the support line of the channel.
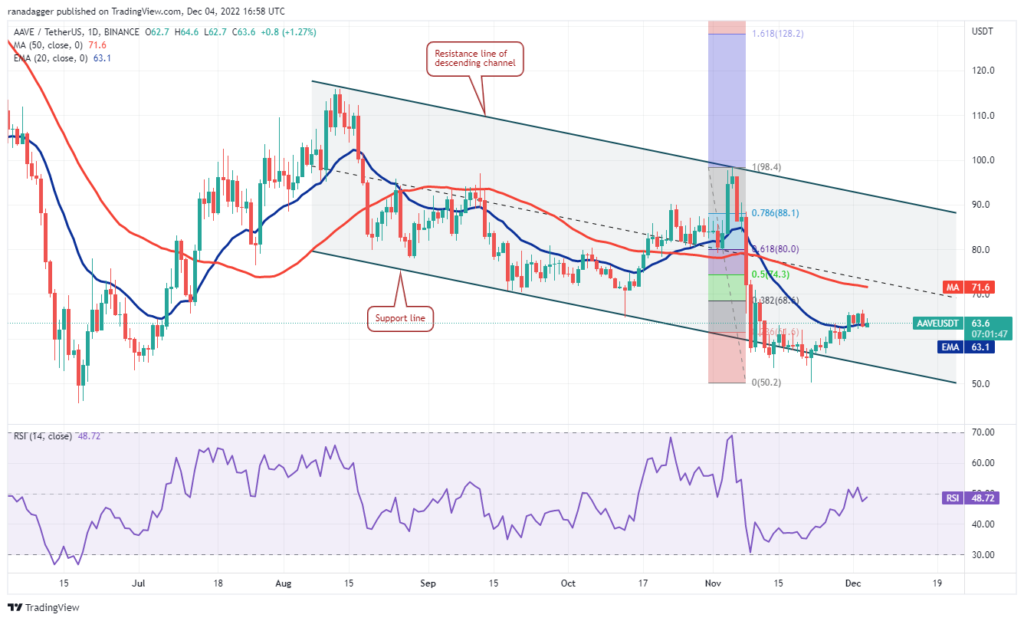
The pair is facing resistance near $66 and the RSI has formed a negative divergence on the four-hour chart, indicating that the bullish momentum may weaken in the near term. A break below the 50-SMA will pull the price into the $56 to $58 support zone. Alternatively, if the price rises from the current level and rises above $66, the pair will move up to $71. This level could act as a resistance, but if the bulls push the price above it, the rally is extended to $80.