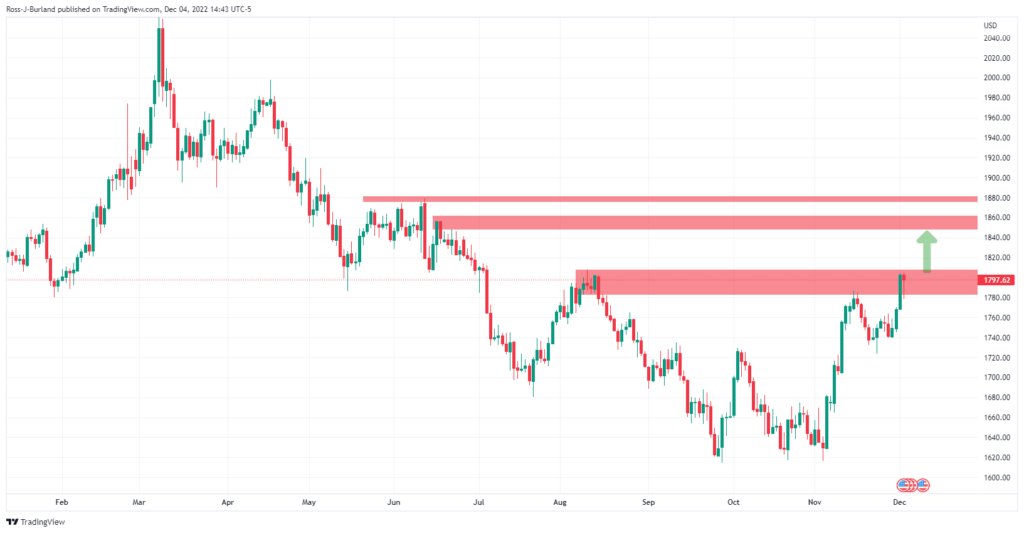
Technical analyst Ross J Burland says gold bulls are encountering daily resistance that holds a break towards $1,860. According to the analyst, failures at $1,800 for gold prices risk dynamic support testing.
“Gold prices have entered an upward trajectory”
cryptocoin.com As you can follow, gold prices closed Friday with a decrease. However, it’s a tap away from its highs set for the day and the week. The yellow metal gained strength and climbed above $1,800 after Federal Reserve chairman Jerome Powell’s statements that the Fed would slow in rate hikes. However, after the release of the US November employment data, the sentiment is mixed. Gold is holding below Thursday’s bull cycle highs and a few dollars below $1,800.
Non-Farm Employment data came in stronger than expected. This reflected the tightness of the hiring labor market. However, investors turned away from the dollar as Fed officials talked dovish about the outlook. Thus, the dollar weakened and withered. Analysts at TD Securities state that gold prices have entered an upward trajectory towards $1,800. They also say that the yellow metal should see the position increase again next week. In this context, analysts make the following statement:
However, inflation is still a big problem. Also, strong wage and employment data continues. So, if the Fed isn’t doing as much dovish as currently expected on December 14, it’s possible for a long loss to happen again.
Technical view of gold prices in charts
Technical analyst Ross J Burland draws the technical picture of gold on hourly and daily charts. Gold prices stalled leaving a top M pattern on the 4-hour chart in a broader bullish scenario.
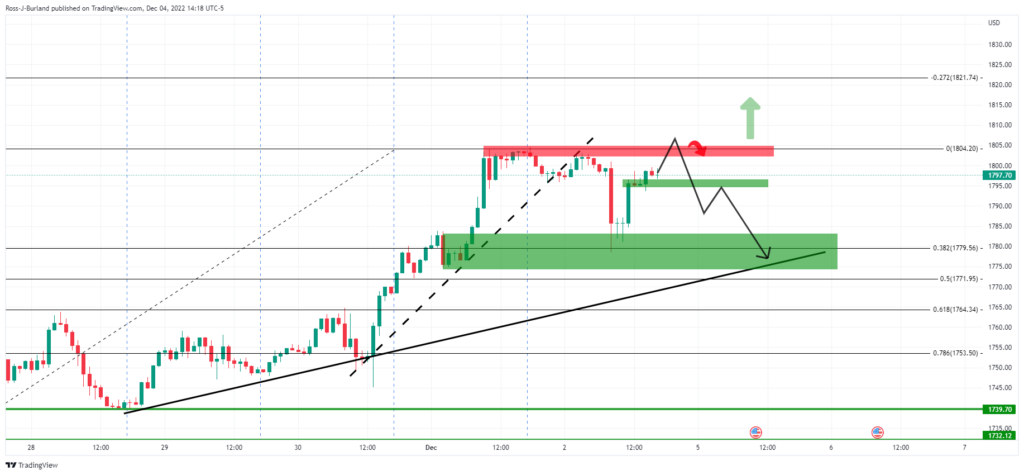
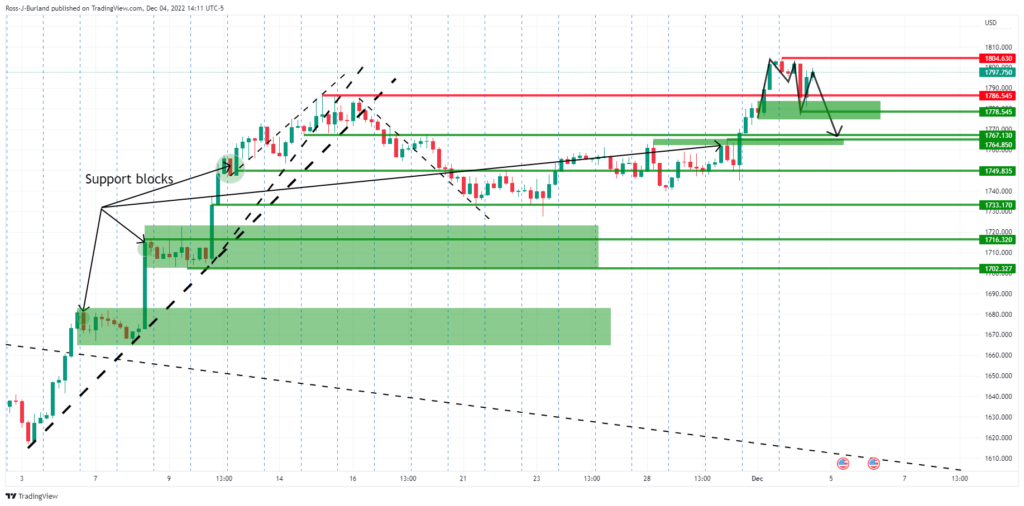 Gold prices 4-hour chart
On the backside of the trend, the price is bullish relative to the harmonic pattern while above the lows of the W-form near $1,730. Now, let’s zoom in a bit.
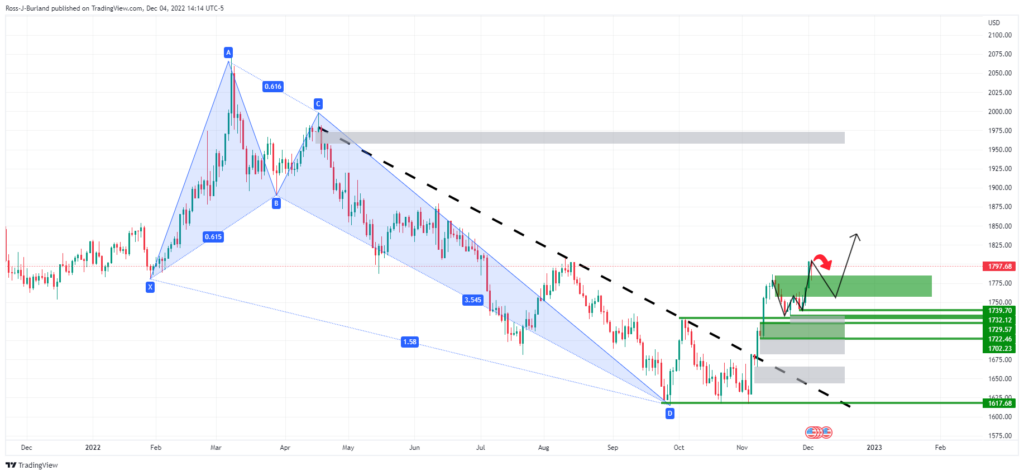 Gold price daily chart-1
As shown above and below on the hourly chart, there is a possibility of a correction towards the neckline of the W-formation in the coming days.
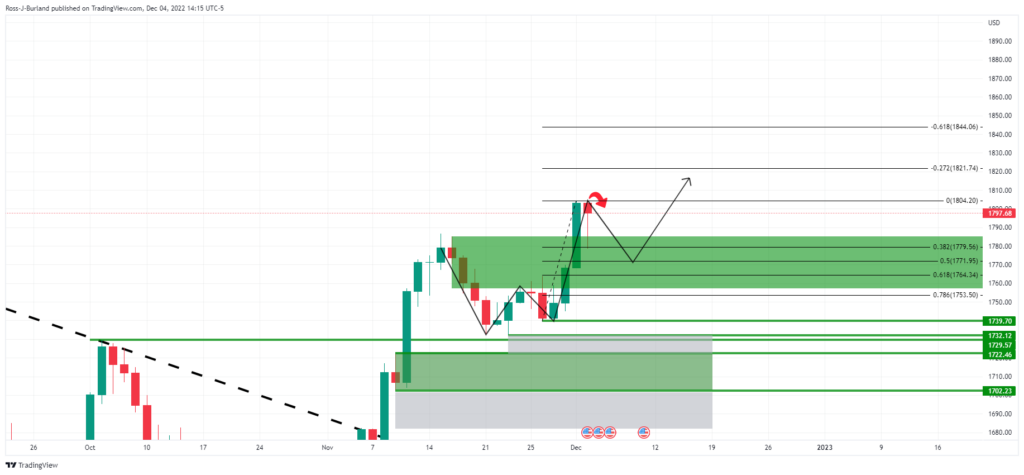 Gold price daily chart-2
Meanwhile, with the price potentially grounding the $1,790 levels, a move to test the $1,800 levels could attract sellers again for opening sessions, with a move to dynamic support meeting the daily 38.2% Fibonacci and 50%. below that means return.
Meanwhile, with the price potentially grounding the $1,790 levels, a move to test the $1,800 levels is possible, with a move to dynamic support meeting the 38.2% Fibonacci daily, to re-pull sellers for opening sessions. However, below this is the 50% Fibonacci average reversal probability.
 Gold price daily chart-3
However, if the bulls commit, there will be a breakout towards $1,860 on the cards according to the daily chart.