Bitcoin (BTC) price strength allows cautious Bitcoin analysts to set targets above $17,500. BTC rallied above $17,000 on Monday as analysts confirm upside targets.
Bitcoin analysts look to bullish near-term
Bitcoin (BTC), which has reached three-week highs, retains its overnight gains. BTC’s weekly close was encouraging for some. Because Bitcoin has reached its highest level since the FTX scandal broke out. Now, analysts are hoping that the upside move will continue towards $20,000 as various resistance zones are in play. Popular analyst Michaël van de Poppe says in an update:
Slowly but surely, BTC is moving upwards. It needs to exceed $17.4-17.6K. But then we’ll likely continue fairly quickly towards $19,000.
In another post, the analyst shared a BTC chart with the relevant price levels. For the successful predictions of Michaël van de Poppe cryptocoin.comCheck out this article.
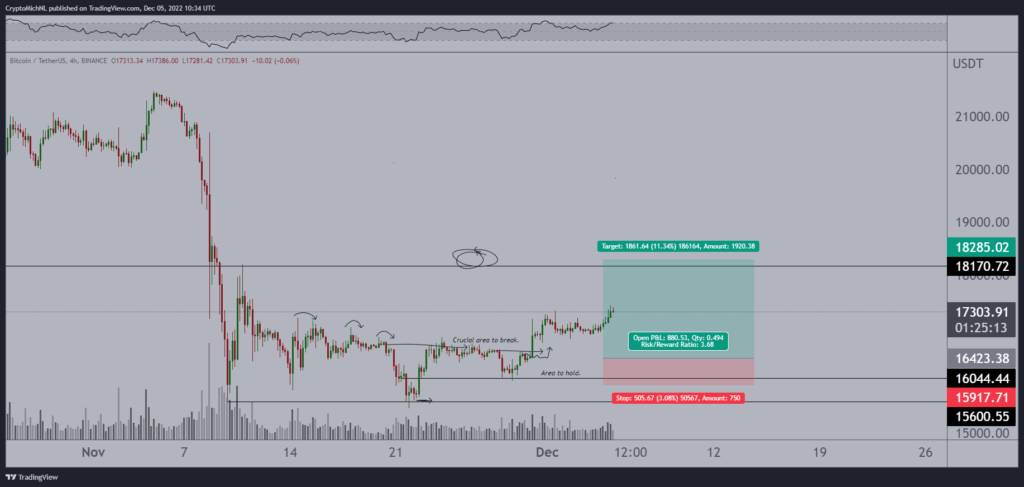 BTC annotated chart / Source: Michaël van de Poppe / Twitter
Other analyst Titan of Crypto is marking $18,500 as a tough resistance zone to watch. Accordingly, he notes that a daily close above $17,167 would be ‘encouraging’.
Analyst DoopieCash shares a chart showing $17,552 as the definitive level on daily timeframes. Besides, the analyst asked, “Are we leaving the range this week?” she inquires.
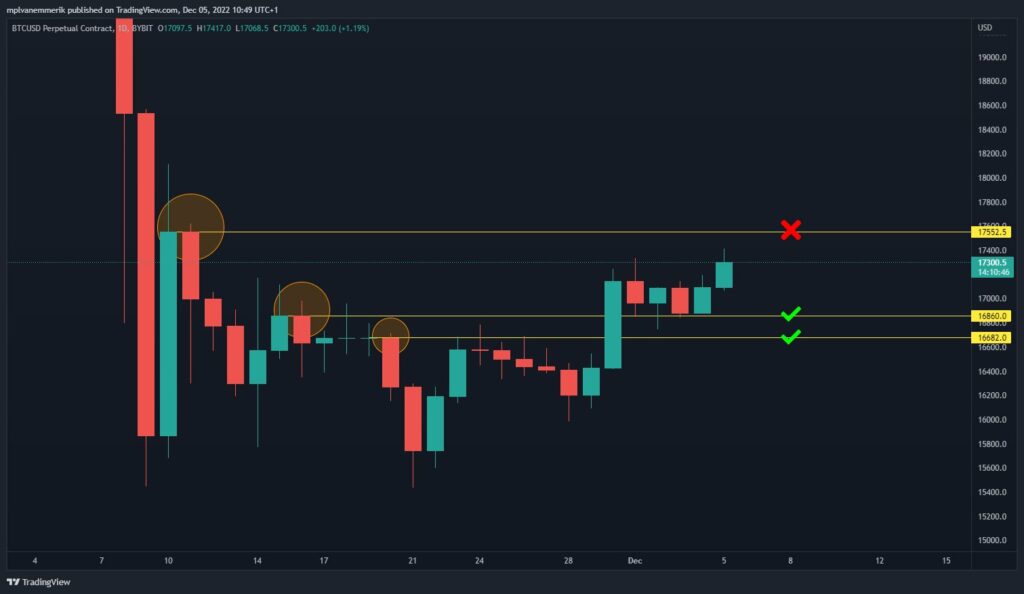 BTC caption chart / Source: DoopieCash / Twitter
Meanwhile, analyst Mustache is still optimistic. The analyst points to a classic bottom pattern, inverted head and shoulders, ‘in full swing’ on the 12-hour chart.
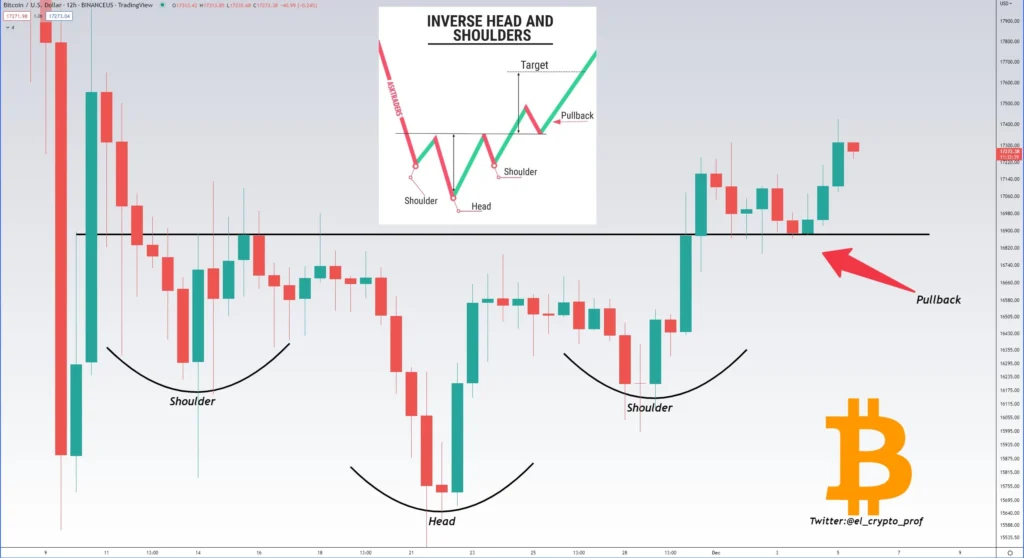 BTC caption chart / Source: Mustache / Twitter
Dollar strength faces tense week
Meanwhile, the US dollar is near five-month lows, which could yet be a boon for Bitcoin. The US dollar index (DXY) remains the focus of the macro chart.
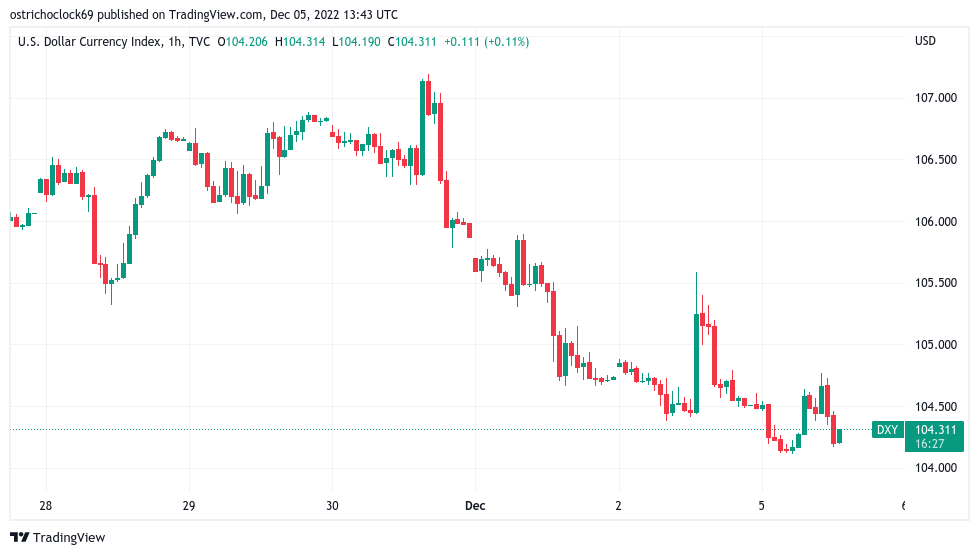 US dollar index (DXY) 1-hour candlestick chart / Source: TradingView
Meanwhile, NorthmanTrader founder Sven Henrich points out the ongoing inverse correlation between DXY and the S&P 500. In this context, the analyst makes the following statement:
An important chart to navigate the markets over the past few months: the SPX directional correlation with the US dollar. It still sits at 95%.
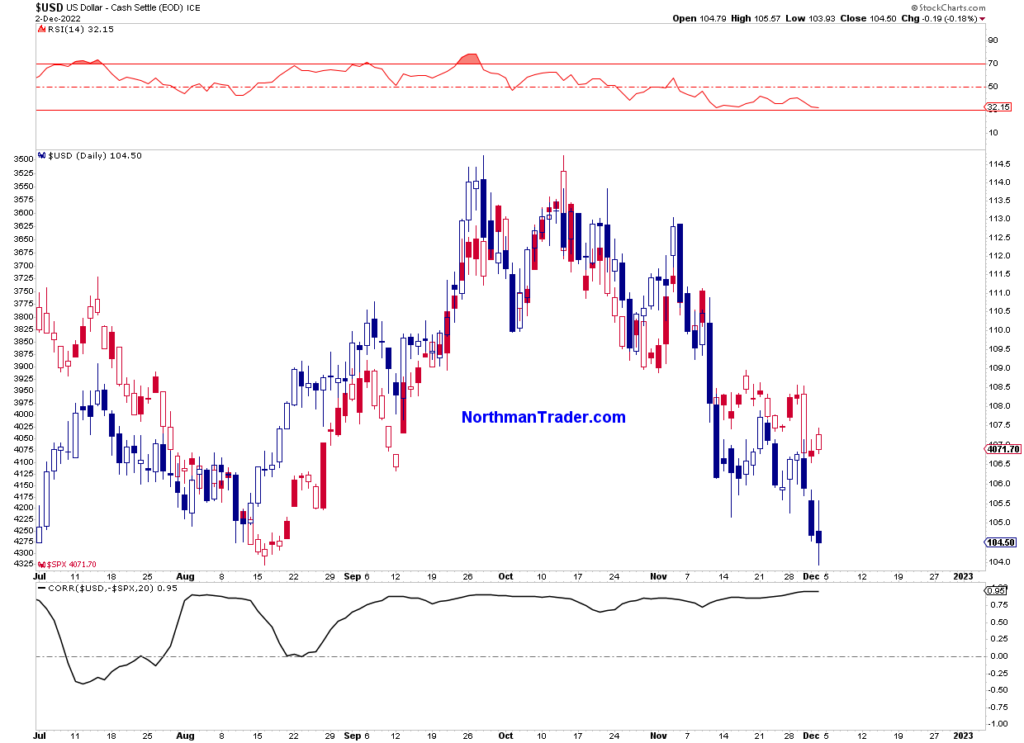 US dollar index (DXY) and S&P 500 explanatory chart / Source: Sven Henrich