
Gold prices rose on Tuesday despite weak trading after the long Christmas weekend. This was due to the fact that the decline in the dollar made the dollar-priced bullion cheaper for offshore buyers. Analysts interpret the market and analyze the technical outlook of gold.
“Sustainable recovery in gold prices is possible if the Fed returns”
cryptocoin.com As you follow, gold started the first week of the year with an increase. Spot gold was up 0.63% at $1,809 at press time. U.S. gold futures rose 0.79% to $1,818. Meanwhile, the dollar index (DXY) fell 0.2%.
The National Health Commission announced that China, the largest gold consumer, will lift the quarantine requirement for arriving passengers from January 8. OCBC FX strategist Christopher Wong says risk sentiment has improved as China eases lockdown rules. In addition, he notes that the softening of the dollar has helped gold prices. Wong also comments:
Gold was weak for most of 2022 amid aggressive monetary tightening, rising real yields and a stronger dollar. However, the situation was reversed when the Fed went into policy adjustment mode. Sustainable recovery in gold prices is possible if the Fed returns.

Gold prices technical analysis
Market analyst Sagar Dua analyzes the gold prices technical outlook as follows. Gold prices surpassed Friday’s high of $1,804.00. It is likely that later on, the auction will shift its profile above the $1,800.00 psychological resistance. The precious metal is likely to continue its upside momentum with the improvement in the risk appetite of market participants.
Gold prices rebounded after testing the bottom of the Rising Channel chart pattern formed on a four-hour scale. The upper part of the aforementioned chart pattern is placed at around $1,786.55, the 15th November high, while the lower part is placed at the $1,740.00 low of the 29th November. The 100-period Exponential Moving Average (EMA) at around $1,791.00 has been a significant support for gold prices. Meanwhile, the Relative Strength Index (RSI) (14) gained strength after falling near 40.00. This indicates that the downward movement is limited.
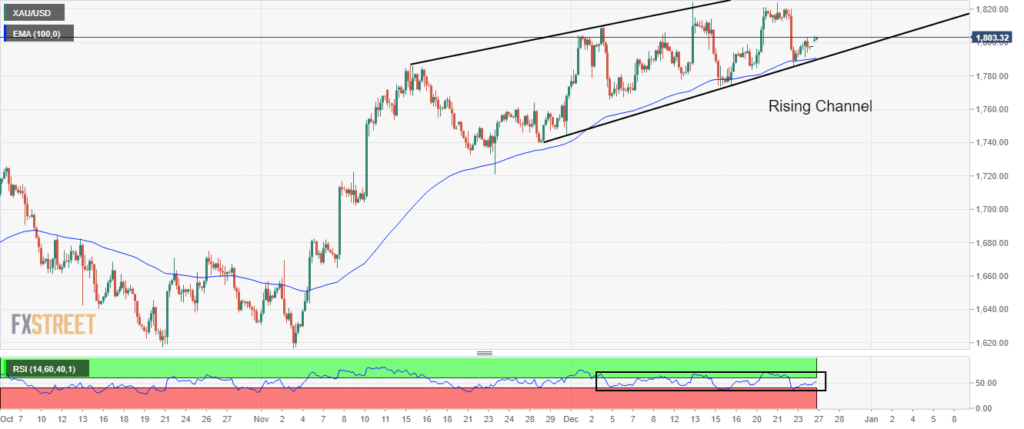 Gold price 4 hour chart
Gold prices technical view
Technical analyst Anil Panchal explains what he saw in the technical drawing of gold as follows. Gold prices rose after jumping from the 200-Day Moving Average (DMA) of about $1,782. The corrective bounce is not overbought but takes cues from the tighter pressures of the RSI (14).
However, bearish MACD signals and an upsloping resistance line near $1,821 from Dec. 5 are challenging further upsides for the precious metal. In a situation where gold buyers manage to break through the $1,821 barrier, successful trading above the monthly high of $1,825 becomes necessary for gold to strengthen.
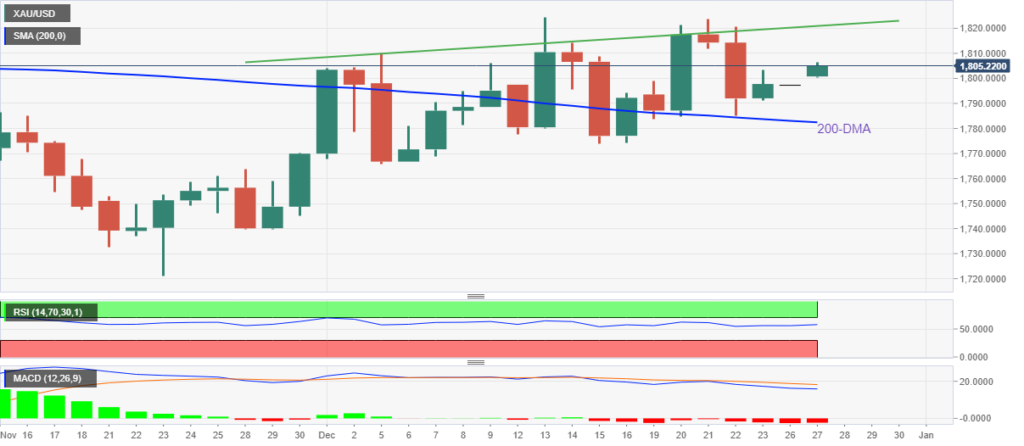 Gold price daily chart
On the downside, a daily close below the $1,782 200-DMA support is likely to quickly push bullion prices to the monthly low of around $1,7695. Following that, a drop near $1,740 and $1,721 at the end of November is likely to entice gold sellers. Overall, gold traders expect further progress despite the recent drop in prices.