
Expectations that the Federal Reserve will slow down have given the cryptocurrency market a spring mood for now. In this environment, the leading crypto Bitcoin (BTC) has reached the threshold of 17 thousand dollars. However, it is unclear whether it will sustain this momentum. Analysts share their views on this issue and explain their forecasts.
Get ready for Bitcoin next week!
cryptocoin.com As you follow, Bitcoin (BTC) started 2023 on a positive note, continuing short-term gains. However, the leading crypto continues to trade below key support levels. In particular, Bitcoin gains in the first week of 2023 can be attributed to the positive macroeconomic data around the US employment news. It is worth noting that as we enter the second week of 2023, Bitcoin’s price action will likely be determined by more macroeconomic news, with the Consumer Price Index (CPI) and inflation data coming out for December.
In this line, crypto analyst Michaël van de Poppe explains what traders planning to trade in BTC should pay attention to next week, noting that the probability of Bitcoin exploding is increasing. However, according to Poppe, despite the impressive breakout rates, Bitcoin will likely test sideways trading for a while. He also points out that the $17,000 target is still possible. Overall, he says, Bitcoin is expected to continue its recovery. In this context, the analyst makes the following statement:
We saw a clear resistance at $16,950. We have a support area around $16,760 here. So it seems clear that we’re going to be on the side for a bit before we start to break out. Because, given the fact that we have already tested the resistor many times, the probability of it breaking has increased.
However, while the CPI data is expected to be positive, the analyst notes that Bitcoin will likely continue to target $17,800, while noting that the increased buying pressure could increase the push. The data will influence the Federal Reserve’s next monetary policy. Van de Poppe warns that a weak economy will likely lead to further rate hikes.
Bitcoin price analysis
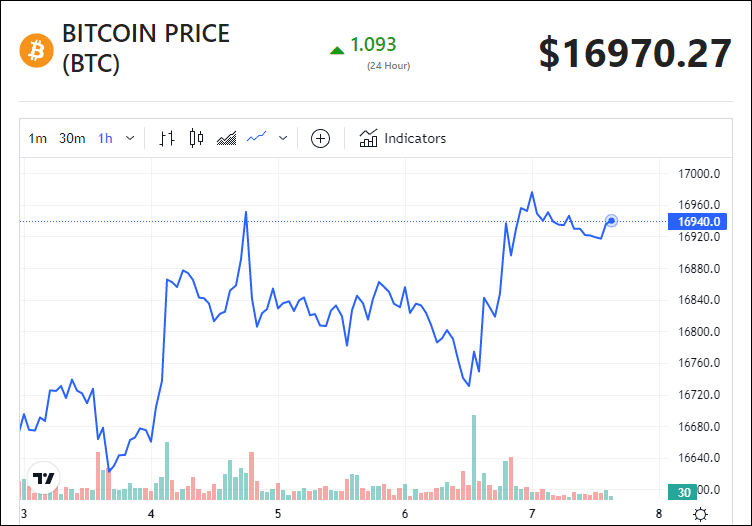
At press time, Bitcoin was trading at $16,949, posting daily gains of around 0.1%. On the weekly chart, BTC is up over 2.5%.
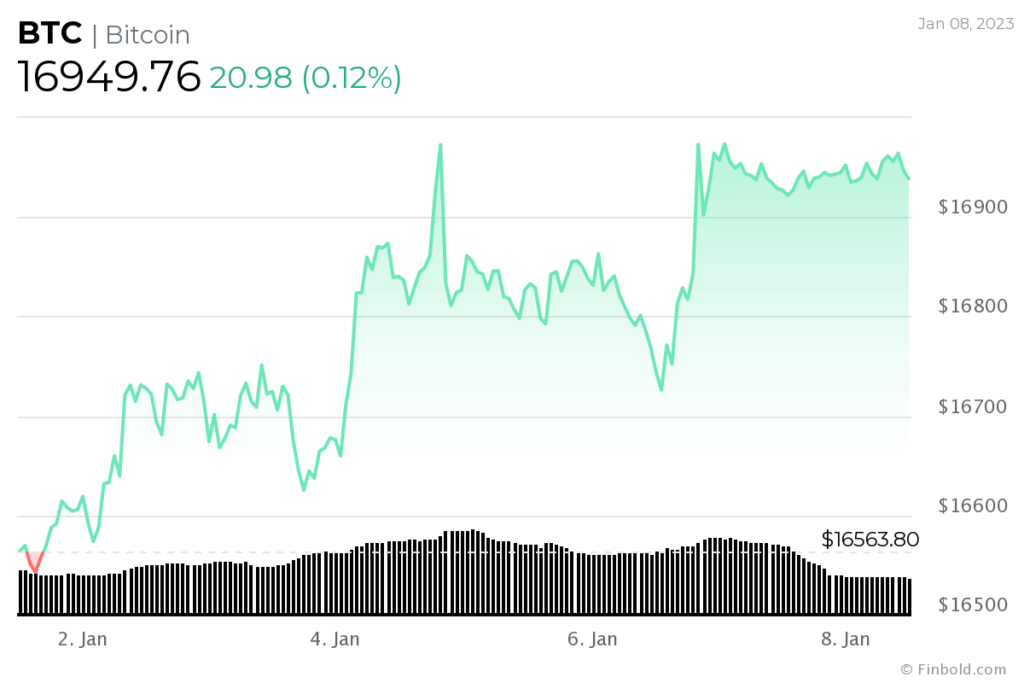 Bitcoin seven-day price chart
Crypto analyst Paul L. describes what he saw in the technical drawing of BTC as follows. Indeed, small weekly gains helped Bitcoin move away from the sideways trading pattern that had characterized the asset towards the end of 2022. Along this line, Bitcoin is attempting to break the $17,000 resistance with a focus on reaching $18,000.
The continued rally came after the US unemployment rate hit 3.5% in December from 3.7% in November 2022. Also, the US economy added 223,000 jobs in December, surpassing an estimated 200,000. Elsewhere, Bitcoin technical analysis on TradingView is mixed. A summary of one-day indicators recommends ‘neutral’ sentiment at 7, while moving averages suggest ‘buy’ at 8. In the oscillators, there is a ‘sell’ feeling at 4.
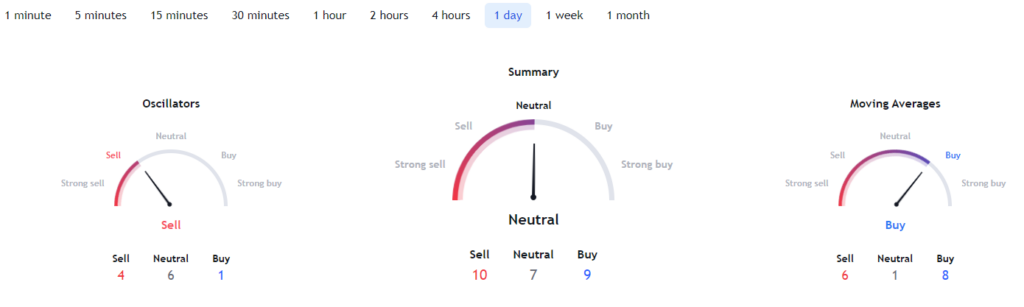 Bitcoin technical analysis / Source: TradingView
In the meantime, it’s worth noting that as Bitcoin tries to sustain its latest rally, the machine learning algorithm at PricePredictions shows that BTC could end the first month of 2023 with a drop. According to the 30-day forecast, Bitcoin could trade at $15,532 on January 31, 2023. Overall, investors are hoping Bitcoin finds a bottom to rise again from 2022 lows. Interestingly, despite the bearish market, Bitcoin’s Blockchain managed to record over $8 trillion in transactions in 2022.
“Leading crypto is still not at the bottom!”
Crypto analyst Tatil Bhuyan evaluates the technical indicators of Bitcoin. The struggle does not end there as Bitcoin can still reach much lower prices in the future. Data from CryptoQuant shows that the price has not yet bottomed out as many expected. During positive crypto market cycles, the price usually stays higher than the realized price. On the other hand, as the bear market approaches the final capitulation stage, a price drop below the actual price causes widespread panic.
The realized price is a measure of the average price weighted by the supply of the amount all market participants paid for their crypto. On-chain can be interpreted as a support or resistance price. Additionally, it is calculated by dividing the realized cap by the total cryptocurrency supply.
In addition, market players are under great stress during this period. As a result, they sell their holdings to avoid further losses. Now, looking at previous cycles, the start of a bull market can be predicted as the BTC price exceeds the realized price. However, this has yet to happen as the price has failed to rise above a certain price point and has recently been rejected downward with significant bearish momentum.
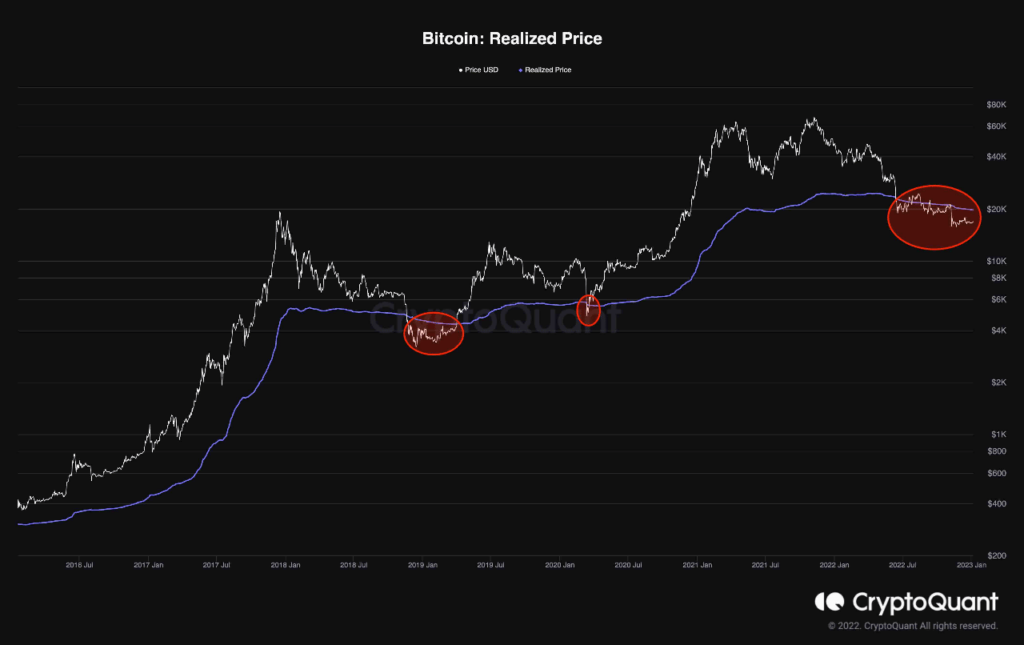
As a result, there is still room for Bitcoin to drop. Also, the current bear market will not end until the price exceeds the actual price, which is currently at $19.7k. Until then, the negative trend is expected to continue.


