
Bitcoin price recovery has witnessed minimal institutional buying, casting doubt on whether BTC will ever rise above $25,000.
Bitcoin price exits descending channel range
First, Bitcoin’s potential to reach $25,000 comes from its exit from a prevailing descending channel range. Notably, the BTC price broke out of the range last week as it accompanied an increase in trading volumes.
The upward move of the cryptocurrency pushed the price above the resistance crossing, which includes a psychological price ceiling of $20,000 and its 20-week exponential moving average (20-week EMA; green wave), as shown below.
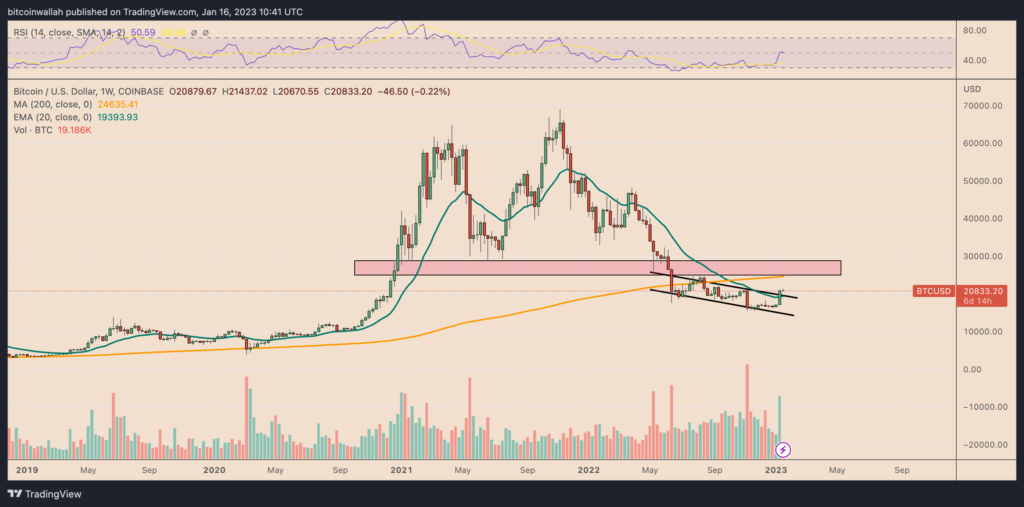
Breaking three resistance levels with strong volumes shows the confidence of traders in a long price rally. If it does, Bitcoin’s next upside target appears to be around $25,000 at the 200-week EMA (yellow wave), meaning a 20% increase from current price levels. cryptocoin.comAs we mentioned, BTC is instantly traded at $ 20,858.
Dollar forms ‘deadly cross’
Bitcoin’s bullish technical outlook appears to be against the backdrop of a relatively weak US dollar amid expectations that the Federal Reserve will stop raising interest rates rather than curbing inflation.
The two assets have mostly moved against each other since March 2020. As of January 16, the daily correlation coefficient between Bitcoin and the US dollar index (DXY), a barometer for measuring the dollar’s strength against major rival currencies, was -0.83.
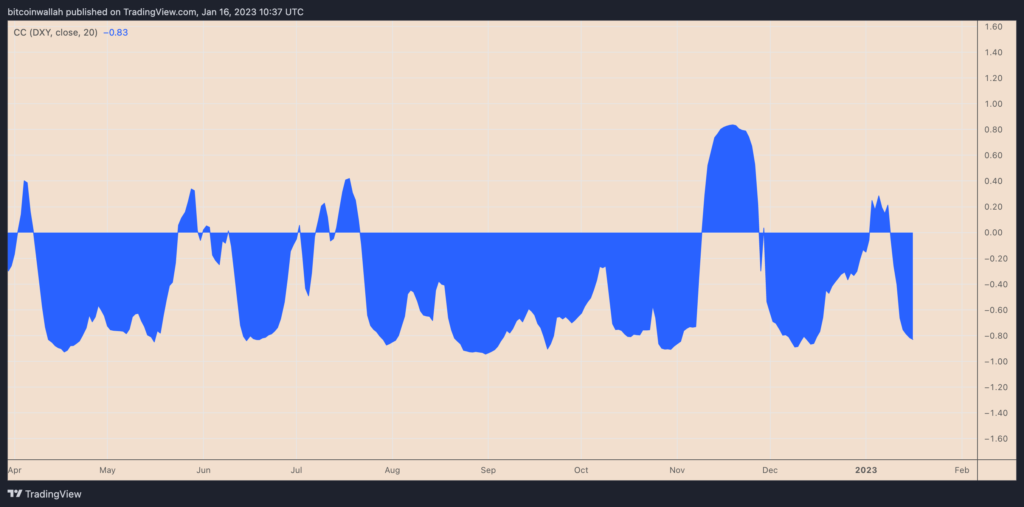
A traditional technical setup sees more losses for the dollar ahead. The so-called ‘death cross’ occurs when an asset’s 50-period moving average falls below its 200-period moving average. The deadly cross for the dollar indicates its weakening momentum, which means its short-term trend is underperforming in its long-term direction.
Independent market analyst Crypto Ed said about the dollar, “I expect more declines in the medium and long term” and added:
“Risk on assets should jump more on this one. Or better: I’m waiting for BTC to break the bearish cycle as the big run on DXY is over.”
Not a long-term Bitcoin price rally
Bitcoin has hit over $20,000 in 2023, up 30% so far. However, on-chain data shows that the buying trend is not supported by institutional investors.
The transferred token metric shows the number of tokens transferred in a given time period. While Funds Flow Rate represents the ratio of money transfers involving the exchange to total money transfers across the network.
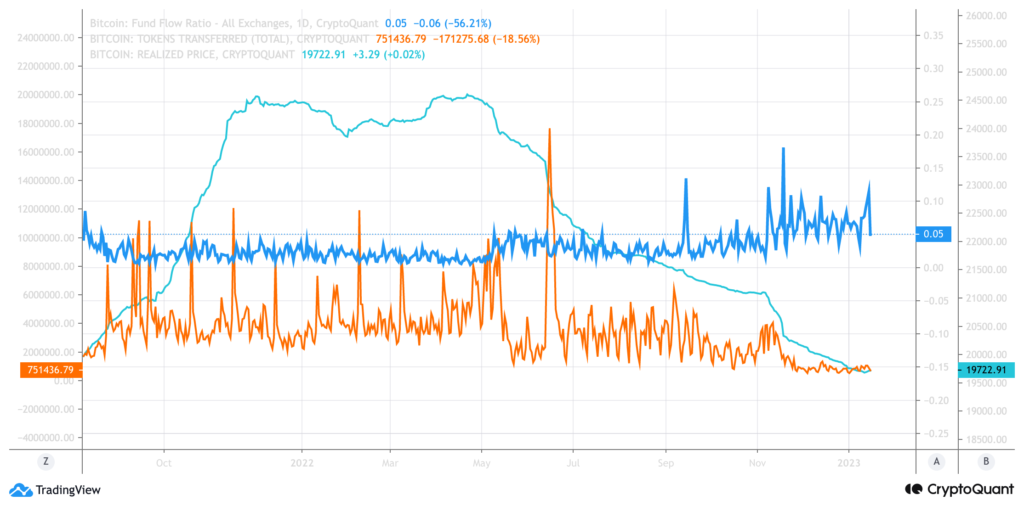
“Usually at the bottom, institutional investors want to buy quietly through OTC trading,” market analyst MAC_D said.
“This trade was only actively traded on the exchange and there were no unusual on-chain transactions. Existing institutional investors remained calm and simply watched. OTC trading will be lively as they anticipate a full-fledged uptrend reversal.”