Aptos (APT) price experienced an incredible rally last week that caught many investors well off guard. According to crypto analyst Akash Girimath, this massive increase may be coming to an end for the altcoin based on technical and on-chain perspectives. Another crypto analyst is assessing whether investors are late for the Aptos party.
Altcoin price points to a local top formation
cryptocoin.com As you follow, the price of Aptos increased by 177% in a week from $ 7.01 to $ 19.31. This explosive move is a combination of the initial rally to $14.57, up 106%, followed by a 19% drop to $11.75. Using the trend-based Fibonacci tool on these three points ($7.01 $11.75 and $14.57) is 50%, 61.8%, and $14.53, $16.43 and $19.31, respectively. It shows three critical extension levels, 100. The momentum was strong enough to push Aptos price to split the first two extensions and tag the third.
There are two bearish signals as APT retests $19.31. These are the bear trend and the unfavorable 30-day (Market Value to Realized Value) MVRV. The altcoin price formed higher local peaks on January 21 and 25, but the Relative Strength Index (RSI) produced lower highs. This inconsistency is a clear indication of diminishing momentum and hints that APT price action could be watched soon. In such a case, key levels for a pullback include the $16.43 and $15.53 support levels.
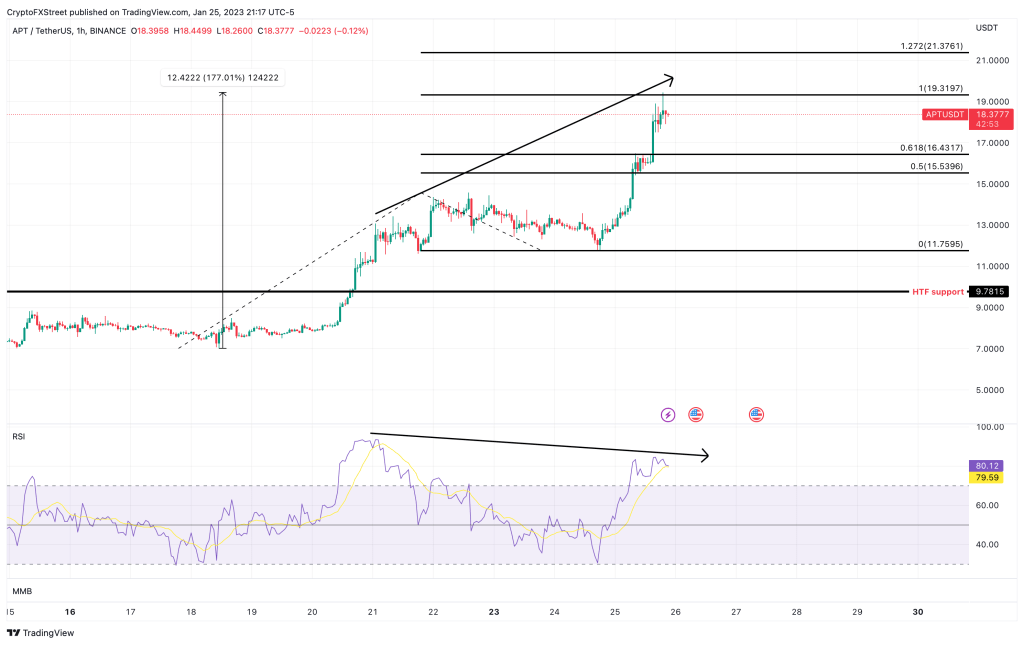 APT 1-hour chart
30-day MVRV peaking at 19.50%, further confirming the local peak formation for Aptos price. This value is the average profit of all addresses that purchased APT in the last month. Interestingly, from a historical perspective, there was a significant sell-off in APT after MVRV entered the region of 17% to 32%. This can be seen in the chart below.
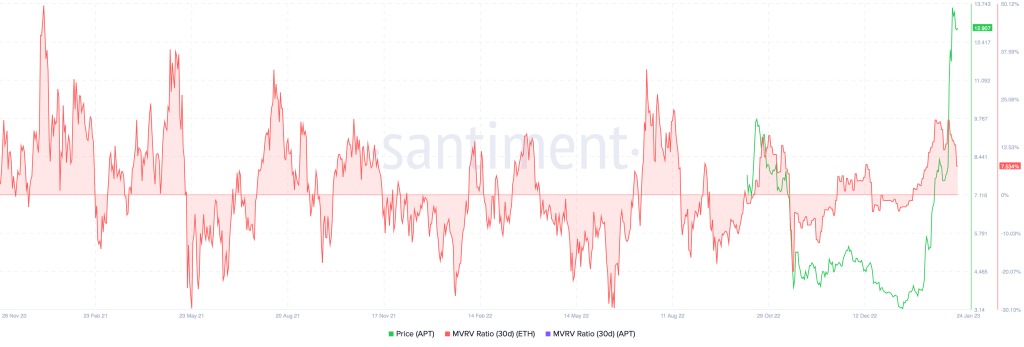 APT 30-day MVRV
Although the outlook for altcoins seems to be bullish, investors need to be extremely careful, especially if the Bitcoin price drops. A minor pullback in Aptos price can be expected. However, if the bulls gain momentum and push the price above the $19.31 resistance level, it could eliminate the bearish bias. In this case, the altcoin price could see the next trend-based Fibonacci extension level at 127.2% or $21.37.
Are you late to the Aptos party?
Bitcoin has emerged from a short-term bull flag pattern. At the time of writing, it retested the $22.9k – $23,000 region. It is also likely to rise further in the hours to follow. Aptos hasn’t needed much encouragement in recent weeks. Despite the overbought conditions, the price is up more than 50% in under two days. This highlighted the strong bullish sentiment. Fading this rally can be particularly risky. But was it wise to try to take the asset now?
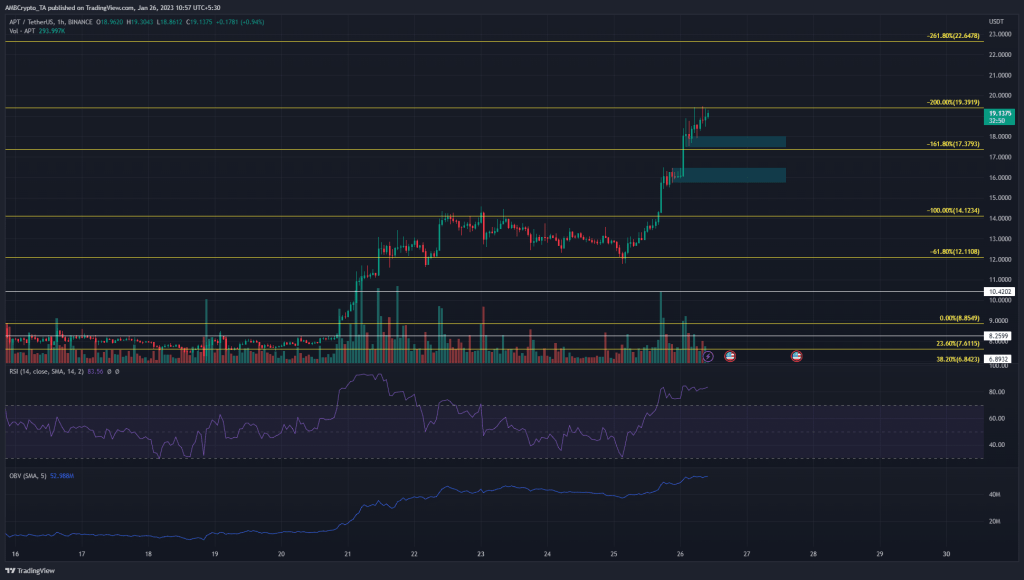
Bitcoin’s impending upward move was a factor that could drive APT to make more gains. A few days ago, Aptos consolidated in the $12-14 region and then rose to $19. Similarly, traders can wait for another range to be created. The near-term consolidation seen at $16 and $17.7 highlighted in cyan is a place to look out. A sharp bullish response from either of these levels could herald the bottom of a range.
It’s good to be careful!
It is also possible for APT to return below $16. If this happens, the $14.12 level could see the bulls re-enter the market strongly. On the other hand, a long move above $19.39 would be the more dangerous scenario. This could be fueled by short liquidations rather than demand, and trying to trade this move can be risky. The 4-hours RSI was above the 70 mark to indicate strong bullish momentum. Also, no bearish trend has formed yet in this time frame. OBV has also made higher lows over the past 24 hours to show steady buying pressure. Spot CVD declines and Open Rate and funding rate means volatility may arise
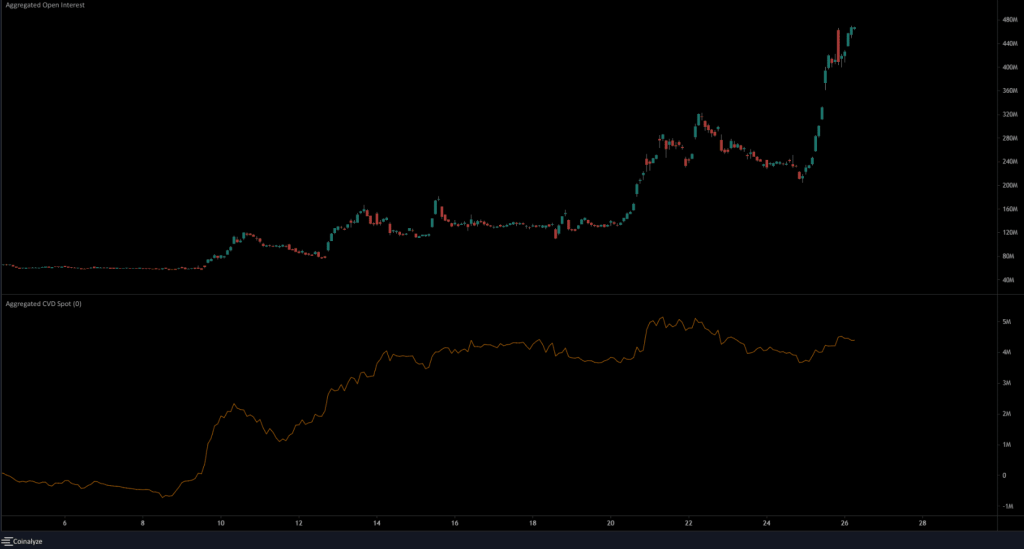 Source: Coinalyze
Open Interest has increased tremendously over the past three weeks. Spot CVD was also in a strong uptrend until January 21st. After that, spot CVD slowed to a series of low peaks. Despite this, OI continued to rise massively. Coinglass data showed that the funding rate was extremely negative. This is a sign that many traders are trying to short APT. This could see a ‘short squueze’ to force early shorts to vomit their positions before a downward reversal. Such a short squeze would be the riskiest scenario to try to trade.