DOGE and certain cryptocurrencies continue to consolidate near their recent highs, increasing the likelihood of an upside break. cryptocoin.comWe have compiled the buy-sell tactics for these cryptocurrencies for you.
Policy decisions will be announced next week
After a massive two-week rally, the price of Bitcoin has remained largely stable this week. This is a positive sign because it shows market participants are not nervous before a series of central bank meetings are held next week. It was announced that the US Federal Reserve, the European Central Bank and the Bank of England will announce their policy decisions next week.
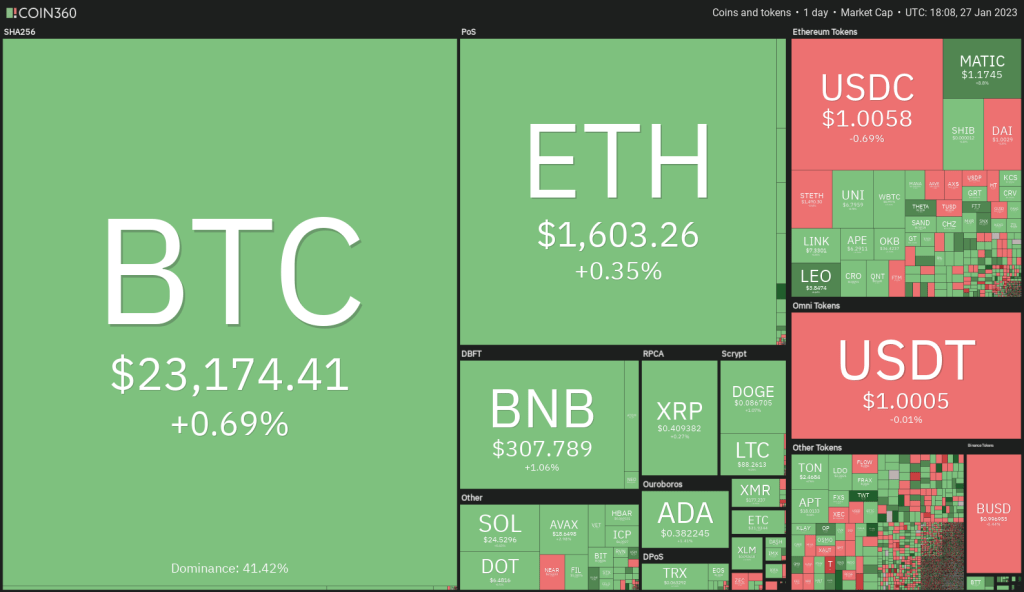
Bulls’ confidence has risen once again after the US’s December core personal consumption expenditure (PCE) data showed the slowest annual rate of increase since October 2021. Core PCE met analyst expectations, up 4.4% from a year ago.
According to a report by Markus Thielen, head of research and strategy at Matrixport, US institutions have not abandoned the cryptocurrency markets. The financial services firm came to this conclusion by assuming that the reason the gains occurred during US trading hours was because institutions were buying. Using this metric, the firm said that 85% of the January rally was due to institutional buyouts.
DOGE, BTC and 8 other altcoins
Bitcoin (BTC)
Bitcoin rallied to $23,816 on January 25, but the bulls were unable to sustain higher levels, as seen from the long wick on the day’s candlestick.
Failure of the BTC/USDT pair to hold above $23,000 may encourage short-term investors to take profits. Immediate support is at $22,292. If this level gives way, the pullback could reach the 20-day exponential moving average or EMA ($21,172).
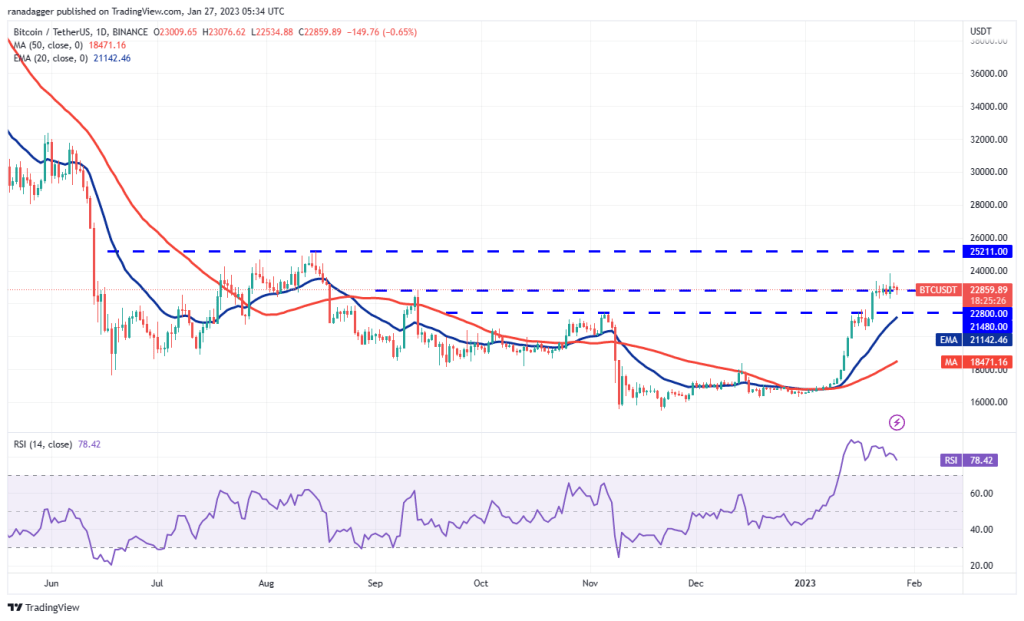
This is an important level to consider because a sharp recovery will mean strong demand at lower levels. The pair could then try to continue its upward move again and reach the critical overhead resistance at $25,211.
On the other hand, if the price drops and breaks below the 20-day EMA, it signals that the bulls are rushing towards the exit. The bears could regain control below $20,400.
Ethereum (ETH)
Buyers failed to see Ether recover solidly from the 20-day EMA ($1,520) on Jan. 25, suggesting that the bears are selling on rebounds near the overhead resistance of $1,680.
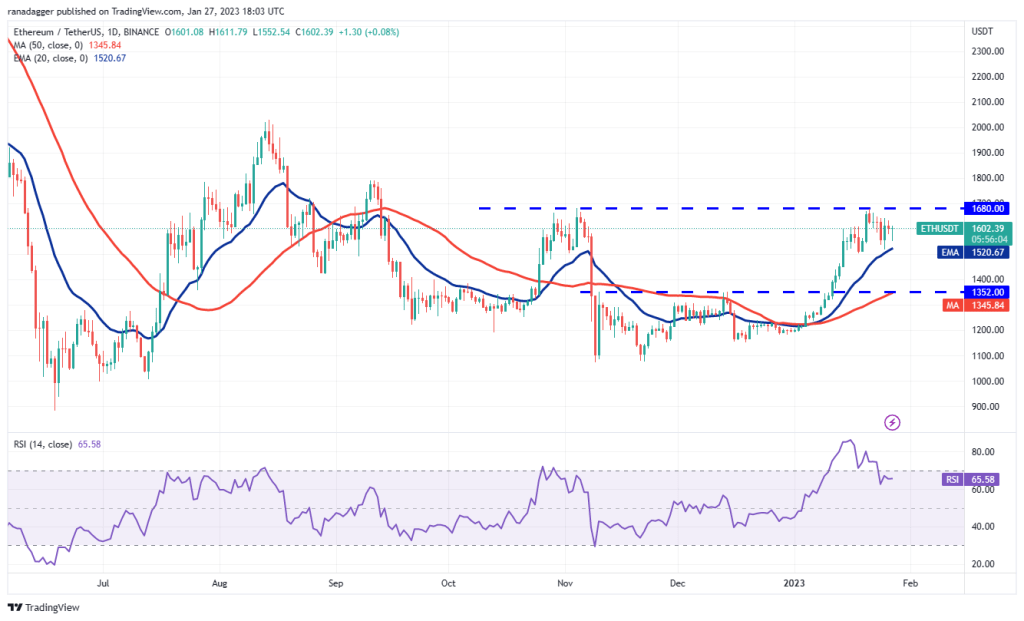
The bears will have to push the price below the horizontal support, at $1,500, to turn the short-term advantage in their favour. The ETH/USDT pair could then start to decline towards the strong support at $1,352.
If the bulls want to avoid this near-term bearish outlook, they will have to quickly push the price above the overhead resistance of $1,680. If they manage to do so, the pair could start its journey towards $2,000 with a short stop-over at $1,800.
Binance Coin (BNB)
BNB has been stuck between the 20-day EMA ($293) and the overhead resistance at $318 for the past few days. This indicates that the bulls are buying the dips to the 20-day EMA and the bears are selling on the rallies around $318.
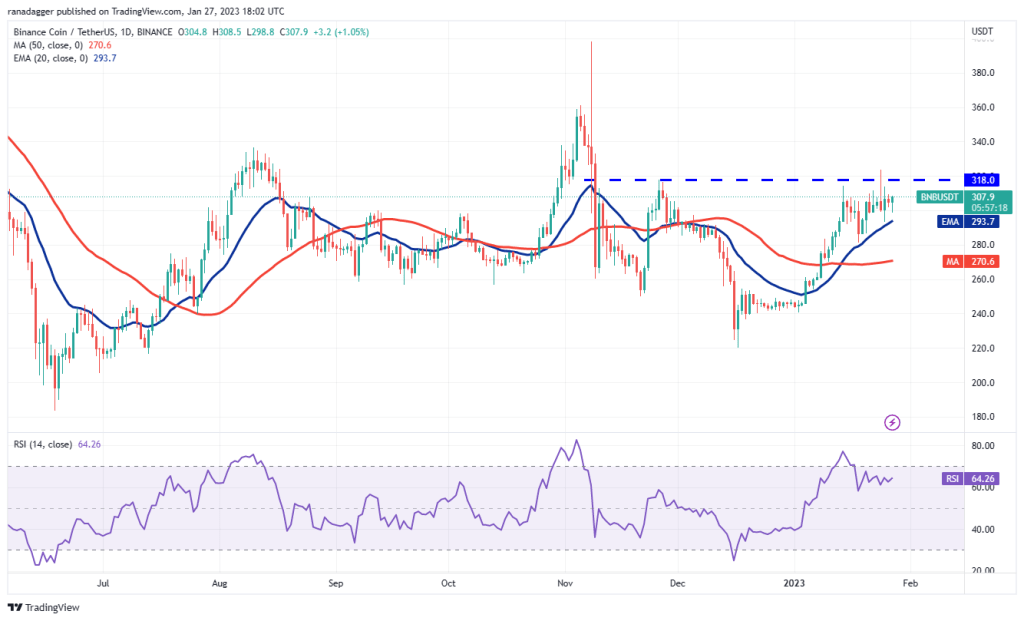
The rising 20-day EMA and the relative strength index (RSI) in the positive zone suggest that buyers have a slight advantage. To develop this advantage, the bulls will need to push and sustain the price above $318. If they are successful, the BNB/USDT pair could gain momentum and rally to $360.
The bears may have other plans. They will try to fiercely defend the $318 level and push the price below the 20-day EMA. If they do, the pair could drop to $281. This level could act as a minor support, but if it breaks, the pair could touch the 50-day simple moving average or the SMA ($270).
XRP
XRP bounced off the 20-day EMA ($0.39) on Jan. 25 and broke above the overhead resistance of $0.42, but buyers were unable to hold the price above it.
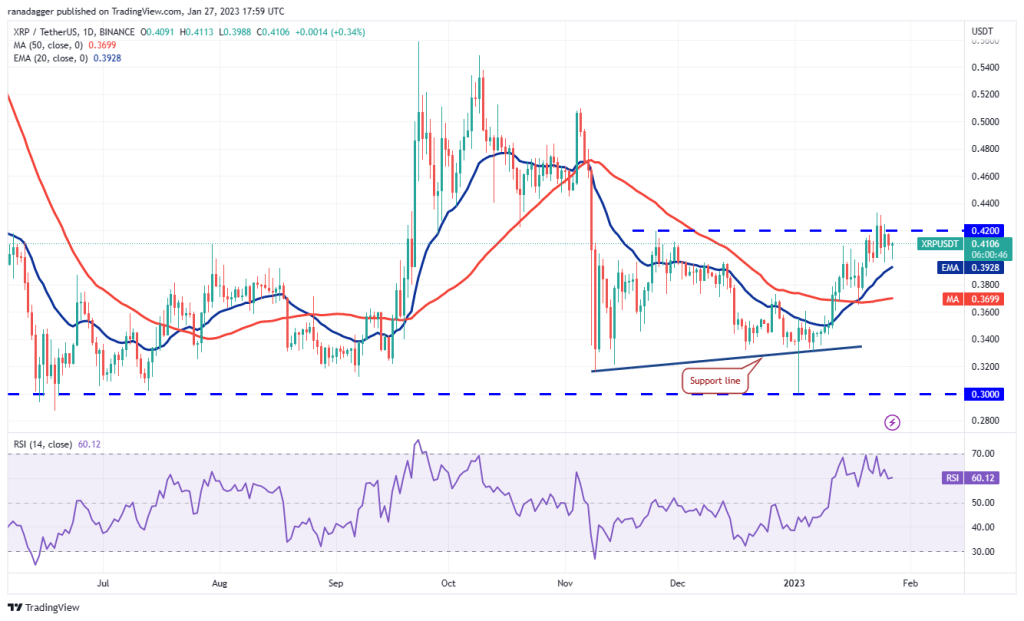
Repeated failure to break through the overhead barrier may encourage short-term bulls to take profits. This could push the price below the 20-day EMA and open the doors for a possible drop to the 50-day SMA ($0.37).
This downside view may be invalidated in the near term if the price rises from the 20-day EMA and surges to the $0.42-0.44 region. The XRP/USDT pair could then start a strong rally that could touch $0.51.
Cardano (ADA)
Cardano’s ADA broke above the overhead resistance of $0.38 on Jan. 26, but the bulls were unable to sustain higher levels. It is worth noting, though, that a resistor tends to weaken if it is punctured frequently.
The bulls will once again try to push the price above the overhead resistance. If they manage to do so, the ADA/USDT pair could bounce back to $0.44. This level can again act as a formidable barrier, but if the bulls do not leave much ground, the pair could resume its uptrend.
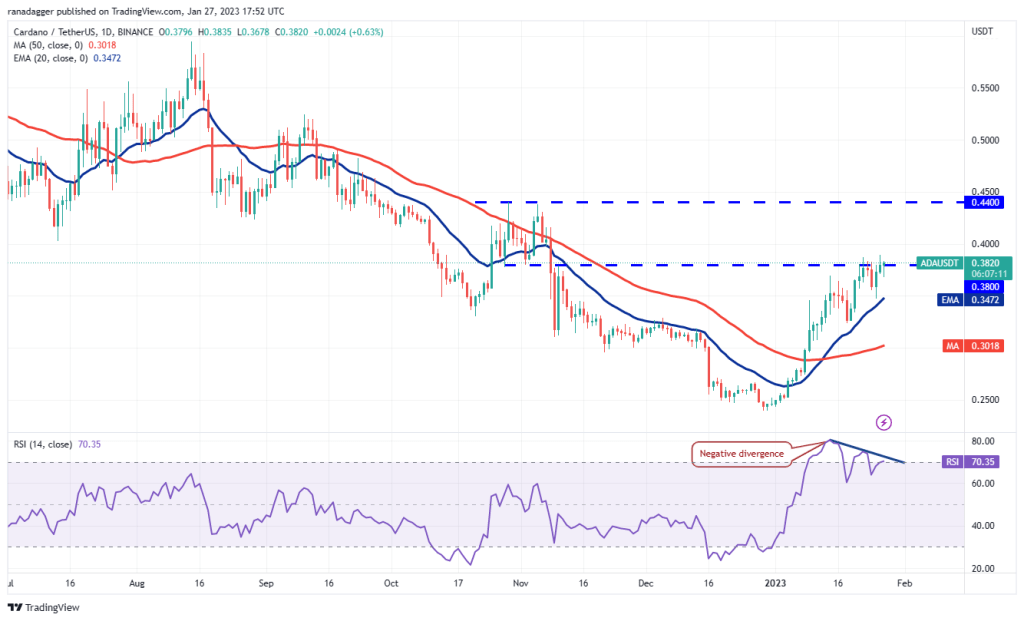
The rising 20-day EMA points to an advantage for buyers, but the negative divergence in the RSI warns that the bullish momentum may weaken. The bears will have to push the price below the 20-day EMA to initiate a deeper correction at the 50-day SMA ($0.30).
Dogecoin (DOGE)
DOGE bounced off the 20-day EMA ($0.08) on January 25, but the bulls were unable to continue the recovery on January 26. The price declined and fell to the 20-day EMA on January 27.
The DOGE/USDT pair has been stuck between $0.09 and the 20-day EMA for the past few days. If the price rises from the current level and rises above $0.09, the probability of a recovery towards the next resistance at $0.11 increases.
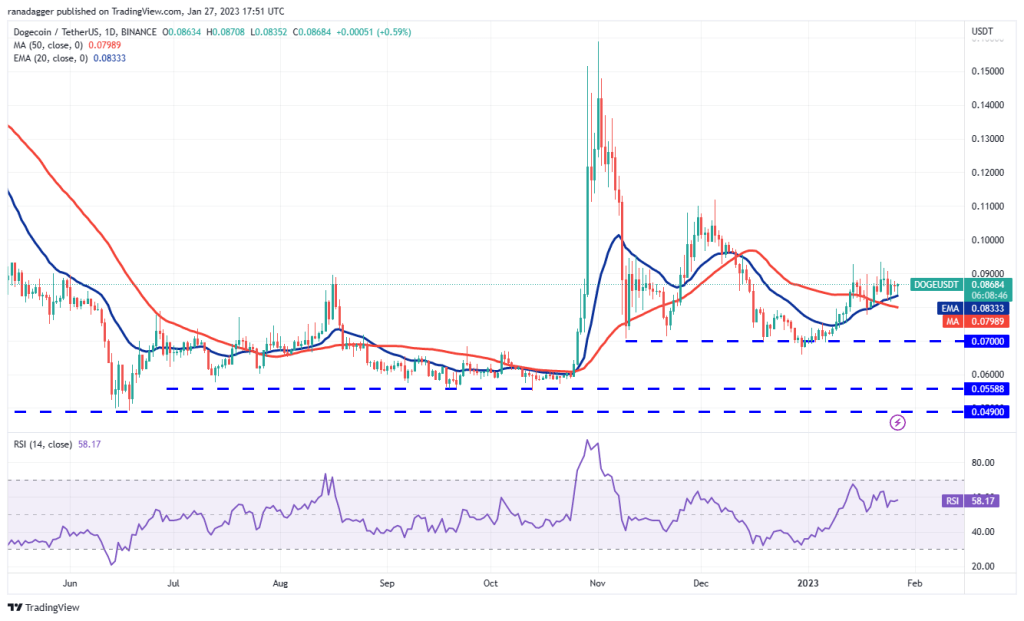
Alternatively, if DOGE price continues to decline and dips below the 20-day EMA, it will indicate that the bulls have lost their dominance. The pair could then dive towards the strong support at $0.07. Such a move could signal a possible range-bound move between $0.07 and $0.09 for a few more days.
Polygon (MATIC)
MATTIC rebounded from the 20-day EMA ($0.97) on Jan. 25 and spiked above the crucial $1.05 resistance on Jan. 26. A break above this level indicates that the uncertainty of the range has been resolved in favor of the bulls.
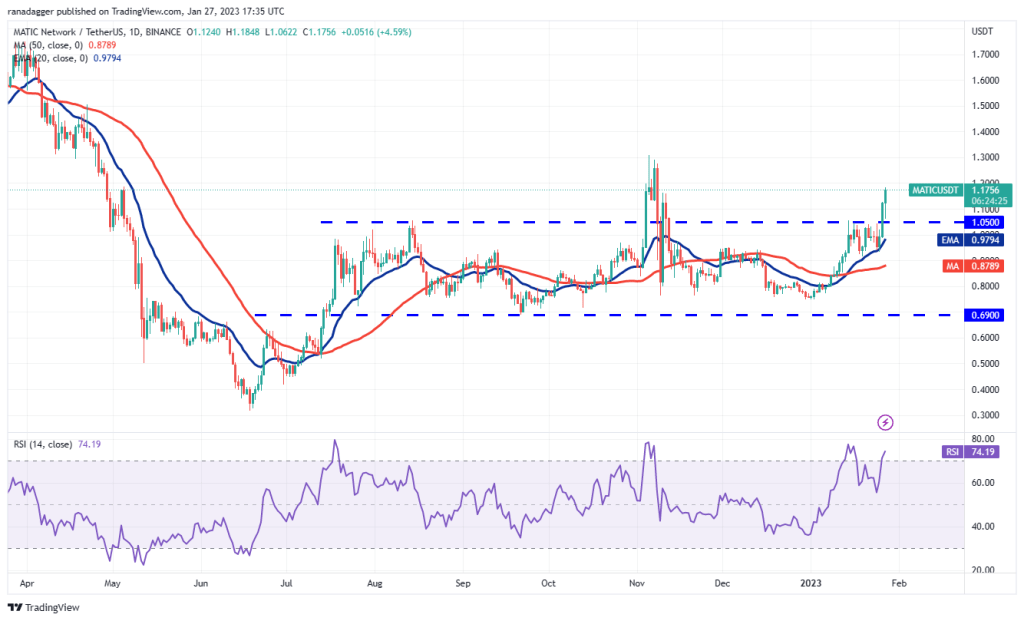
Buyers continued to gain momentum and the MATIC/USDT pair broke the minor resistance at $1.16 on Jan. 27. This paves the way for a possible rally to $1.30 where the bears can once again form a strong defense. If the bulls break this hurdle, the rally could be extended to $1.50.
Conversely, if the price drops sharply and dips below $1.05, it will indicate that a breakout could be a bull trap. The pair could slide to $0.91 later.
Litecoin (LTC)
LTC has been hovering between the 20-day EMA ($85) and the overhead resistance at $92 for the past few days. This signals uncertainty about the next directional move between the bulls and bears.
While the upward sloping moving averages point to an advantage for the bulls, the negative divergence in the RSI indicates that the buying pressure is decreasing. The bears will gain the upper hand if they manage to push the price below the 20-day EMA.
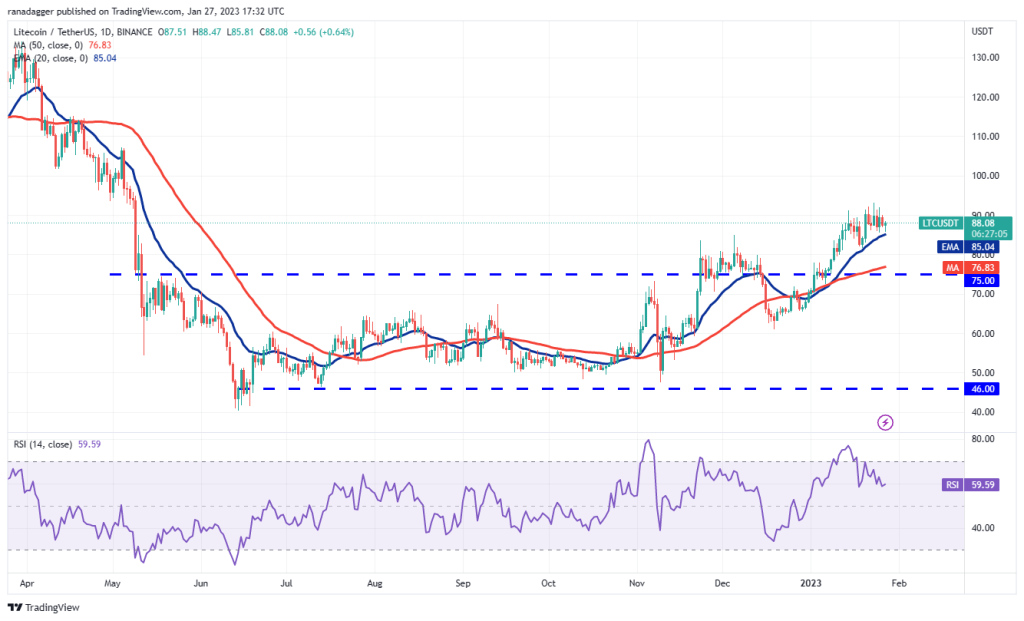
This could trigger short-term traders to stall and the LTC/USDT pair could drop to $81 later and then to $75.
If the bulls want to continue their dominance, they will have to hold the price above $92. This could be a sign that the uptrend is resuming. The pair could then go to $100 and then to $107.
Polkadot (DOT)
The DOT has been trading near the resistance line for the past few days. Generally, a tight consolidation near a strong overhead resistance indicates that buyers are holding their position as they expect a move higher.
If buyers shoot the price above the resistance line, the DOT/USDT pair could signal a potential trend reversal. The pair could then start its journey towards $8.05 with a short stop-over at $7.42.
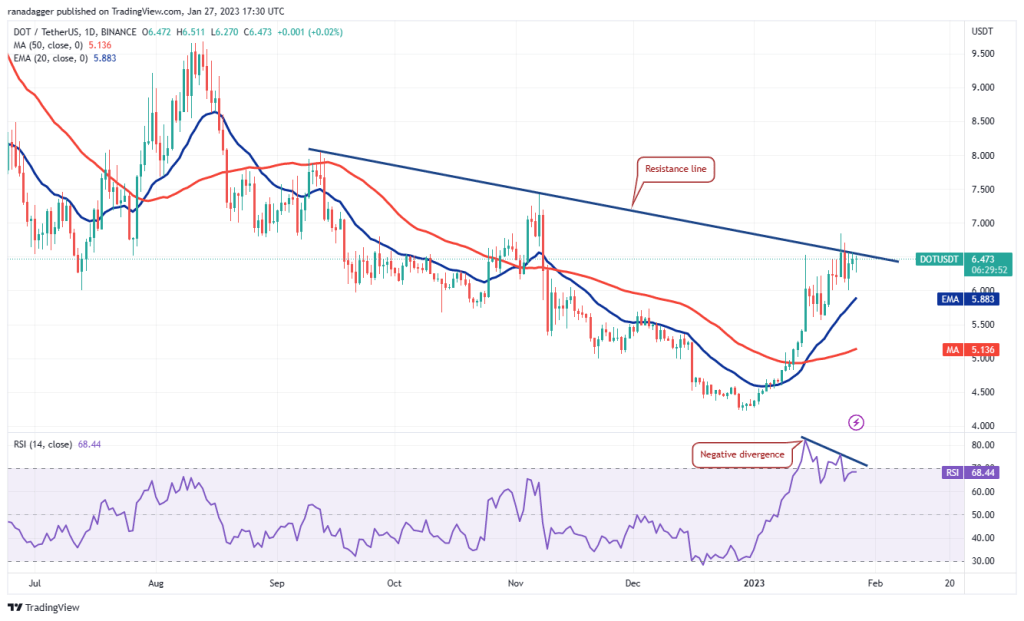
Conversely, if the price fails to stay above the resistance line, it means that demand is drying up at higher levels. This can attract profit booking by short term traders. The pair could first drop to the 20-day EMA ($5.88) and if this level collapses, the drop could reach $5.50.
Avalanche (AVAX)
The bulls attempted to push Avalanche’s AVAX above the resistance line on January 26, but the bears blocked their attempt. The bulls did not surrender to the bears and are trying to break through the barrier again on January 27.
The upward sloping moving averages and the RSI near the overbought zone suggest the path of least resistance to the upside. If the price rises above the resistance line, the AVAX/USDT pair could rally to $22 and then to $24.
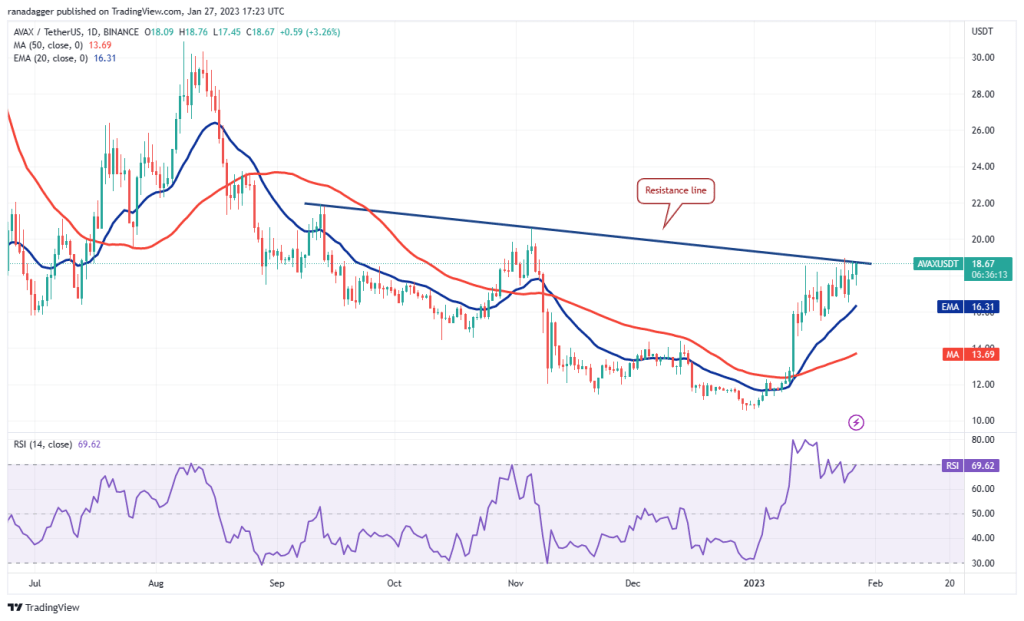
On the downside, a break and close below the 20-day EMA ($16.31) will be the first indication that the buying pressure is easing. This could open the doors for a possible drop to $14.65 followed by the 50-day SMA ($13.69).


