Before the Federal Reserve chairman’s speech on February 7, what awaits the Bitcoin price is discussed.
Bitcoin closed the week with a bearish trend
Bitcoin closed last week with a bearish bias for the first time in five weeks. It reached $24,000 but fell below $23,000 in Monday’s Asian trading session. Fed/Barr will speak at 22:00 after FED Chairman Powell’s statement on February 7 at 20:40. According to Coinglass, over $97 million was liquidated in the cryptocurrency market while traders made profits. There has also been a shift in crypto funds shifting from big-cap altcoins to small-cap altcoins like BabyDoge, which rose over 200% last week.
As the price of Bitcoin retested the low support level of an ascending channel on a four-hour time frame, concerns about the market crash have risen in the crypto community. A well-known analyst, also known as il Capo of Crypto, believes that the price of Bitcoin should not fall below $22.5K to maintain the uptrend.
A break below 22500 is the bearish confirmation. Current bear market rally has created the perfect environment for people to keep buying all the dips when the current trend reverses.
Perfect scenario for a capitulation event in the next few weeks.
— il Capo Of Crypto (@CryptoCapo_) February 5, 2023
The crypto community is advised to stay alert for important news such as Federal Reserve Chairman Jerome Powell’s announcement tomorrow. Powell has significant power over the dollar and interest rates, which causes inflation to rise.
Many analysts are predicting a recession late this year or early next year, and crypto investors are warned to keep this in mind as it can affect prices. But Siemer, CEO of Wave Financial, is more optimistic and believes the recession will not be as severe as before. Despite the resilience of consumers and the gradual effect of the Fed’s actions, the full impact on the economy may not be seen for another quarter or two.
Analyst sees it as good news
OANDA senior analyst Edward Moya said, “Bitcoin appears to be a piece of content circulating around $23,000 and this should be seen as good news for crypto traders. Bitcoin may struggle to surpass the $25,000 level in the short term, as yields are likely to continue to rise.’ said.
Analyst Michaël van de Poppe says Bitcoin is ‘back in the range’ and a drop below $21,700 could be the ultimate liquidity scan. The ideal entry point would be in the $22,300-$22,700 range, while a break of $23,300 would signal an upside continuation. He added that these fixes are relatively shallow.
#Bitcoin back in the range.
Drop beneath $21.7K is the ultimate liquidity sweep.
Levels at $22.3-22.7K would be a great entry as range low.
Break of $23.3K would mean continuation upwards.
Corrections are still relatively shallow.
— Michaël van de Poppe (@CryptoMichNL) February 5, 2023
Analyst TechDev shares that with 406,000 Twitter followers, he believes Bitcoin’s price movements follow global dollar liquidity cycles. He backs up his claim with a chart comparing Chinese ten-year bonds (CN10Y) and the US dollar index (DXY). cryptocoin.comAccording to data, BTC is trading at $ 22,837.
Bitcoin is in the middle of big trend change
A closely followed crypto strategist is optimistic about Bitcoin (BTC) and says the crypto king may be preparing to do the unthinkable. Analyst Kevin Svenson told his 121,600 Twitter followers in a new video that Bitcoin could reach $30,000 much earlier than people expected. According to the crypto trader, the momentum is on the side of the BTC bulls after a large falling wedge formation marking a major shift in trend.
Traders use the RSI to measure the strength of an asset’s momentum. Traditionally, an asset trading above the 70 level of the RSI is considered overvalued and should cool off. But there are cases when an asset refuses to go below the 70 level due to heavy buying.
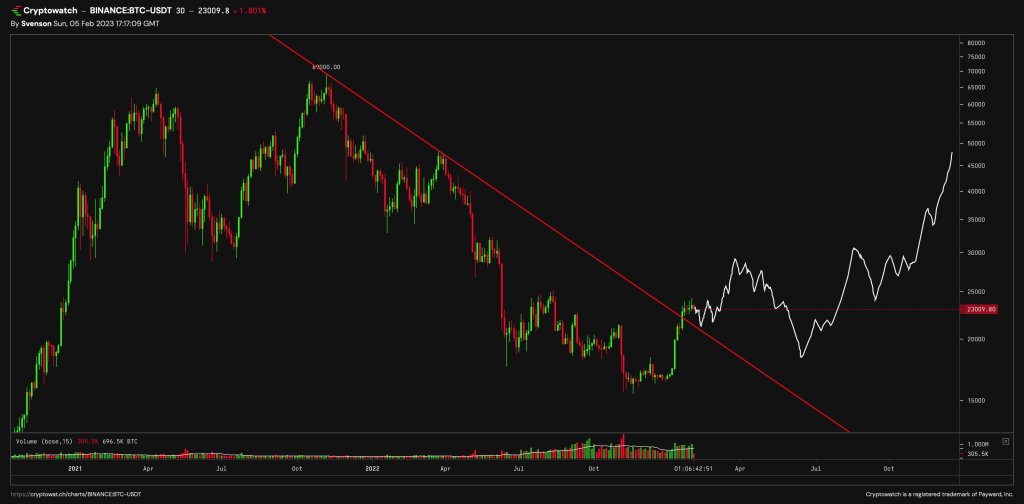
Svenson adds that Bitcoin was floating in overbought territory on the daily chart in late 2020 and eventually broke the $20,000 resistance, a breakout that led to a rally above $60,000. Looking at Svenson’s chart, he seems to predict a massive Bitcoin rally to around $50,000 after the corrective move below $20,000.
With Bitcoin now trading above the diagonal resistance of the falling wedge pattern, Svenson believes BTC is likely on its way to $30,000 before king crypto undergoes any significant corrections.
There may be a sudden change
A closely followed crypto analyst says that there are several indicators that show that Bitcoin (BTC) is now ready to enter a new era. The fake analyst known as TechDev tells his 406,000 Twitter followers that he believes Bitcoin follows global dollar liquidity cycles, illustrating this with a chart that pits Chinese ten-year bonds (CN10Y) against the US dollar index (DXY).
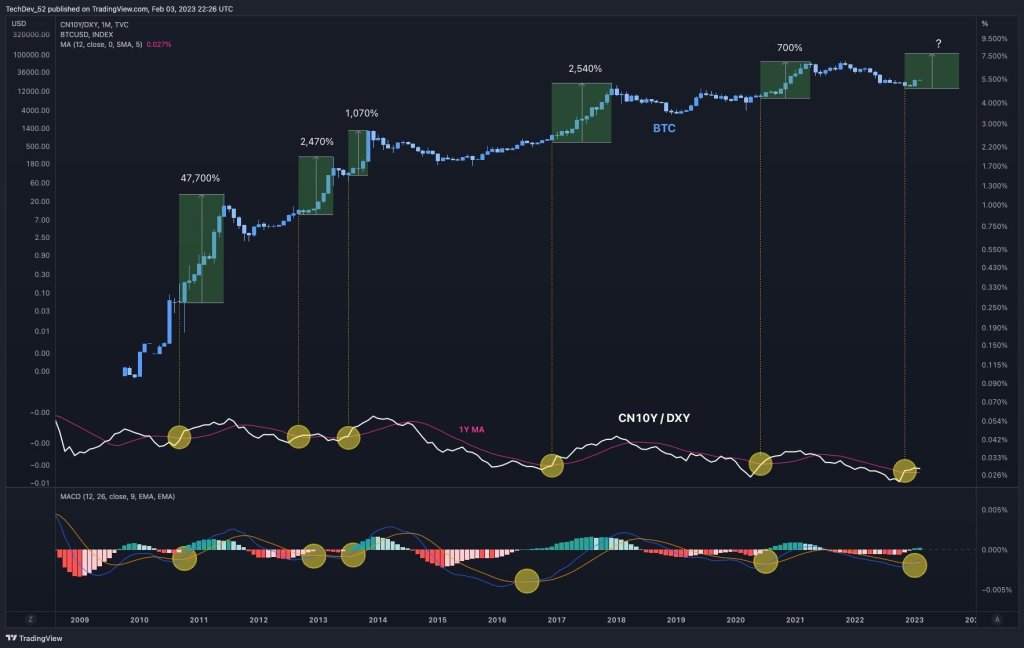
He also points out that Bitcoin’s moving average convergence divergence (MACD) indicator, which aims to detect reversals, is bullish on its monthly timeframe. TechDev reiterates the similarities in market cycles between CN10Y/DXY and Bitcoin to support its thesis.
The analyst also compares the CN10Y/DXY chart with the Bitcoin dominance chart (BTC.D) and the total altcoin market cap, saying that the current market structure is particularly reminiscent of the crypto bull market in 2017. The popular analyst says that the recent price action of BTC on the shorter timeframes shows that the bullish continuation on the higher timeframe. He has been drawing attention to the relatively small amount of red hourly candles for Bitcoin lately.