
BTC, DOGE and these altcoins appear vulnerable to a deeper correction as Paxos spoils the sentiment in the crypto market. cryptocoin.comWe have compiled the trade levels for you.
Tensions may rise among crypto investors
Bitcoin and certain altcoins are threatening to deepen their correction after reports emerged that the US Securities and Exchange Commission (SEC) has issued a Wells Notice to Paxos, alleging that the dollar-pegged Binance USD stablecoin is an unregistered security. Separately, Paxos has been ordered by the New York Department of Financial Services (NYDFS) to cease issuance of BUSD.

Following the crackdown on Kraken last week and now Paxos, the regulator’s actions could raise tensions among crypto investors. FOX Business reporter Eleanor Terrett said on Feb. 12, ‘More Wells reports will come out in the next 2-3 weeks.’ he tweeted. While market watchers await the consumer price index data to be announced today, it was stated that volatility may remain high in the near term.
Trade levels specified DOGE, BTC and these 6 altcoins
SPX
The S&P 500 index (SPX) fell from 4,200 on February 2 and hit the 20-day exponential moving average (4,057) on February 10. This is an important level that the bulls must defend if they want to keep the recovery intact.
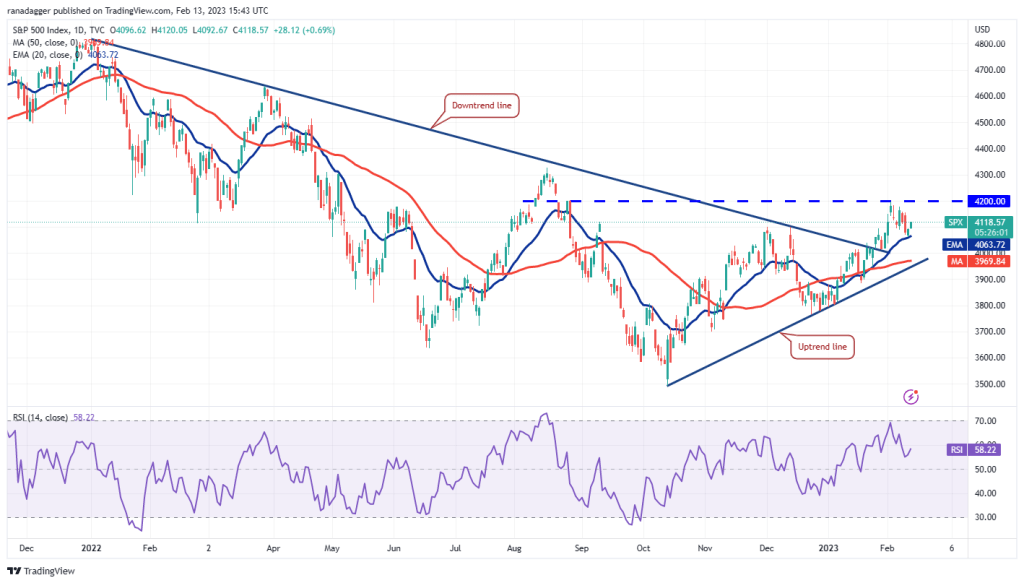
The 20-day EMA is gradually rising and the relative strength index (RSI) is in the positive territory, pointing to a small advantage for buyers. The bulls will try to push the price towards the overhead resistance at 4,200. This is an important level to watch because if the bulls break this resistance, the index could rise to 4,300 and then to 4,500. If the bears want to gain the upper hand, they will have to pull the index below the 20-day EMA. This could bring the index down to the uptrend line.
DXY
The US Dollar Index (DXY) bounced back from the resistance line on February 7 but the bears failed to push the price below the 20-day EMA (103). This indicates a shift from selling dips in rallies to buying.
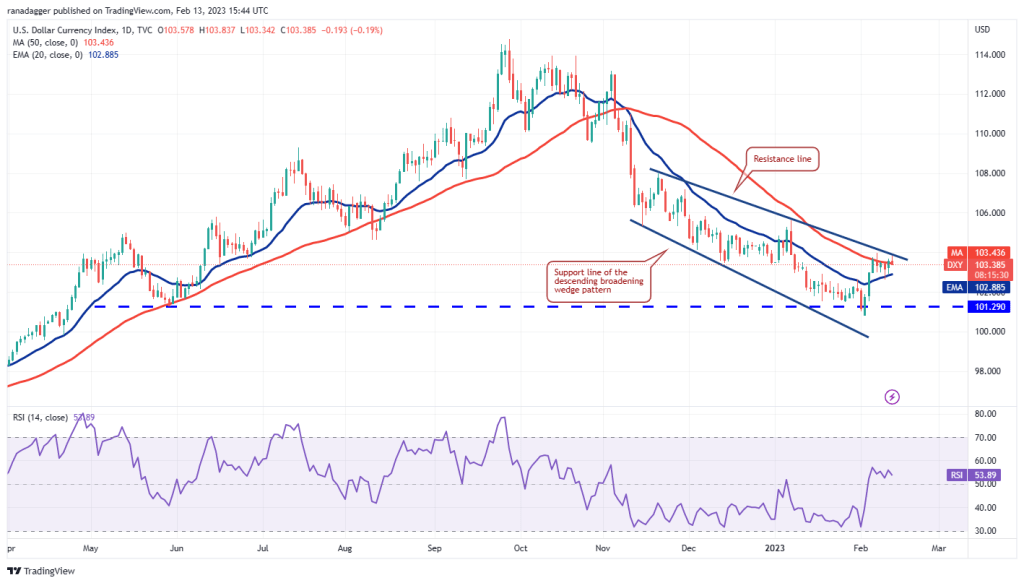
The 20-day EMA has risen and the RSI has moved into the positive territory, indicating that the bulls are making a comeback. If the price breaks and stays above the resistance line, the short-term trend could turn positive. The index could then begin its northward march to 106 and then 108. Instead, if the price breaks down from the current level and dips below the 20-day EMA, this will suggest that the index may extend its stay inside the wedge pattern for a few more days.
BTC/USDT
Bitcoin’s recovery attempt failed at $22,090 on Feb. 12, suggesting that the bears are selling on every small rally and do not expect the price to reach the 20-day EMA ($22,241).
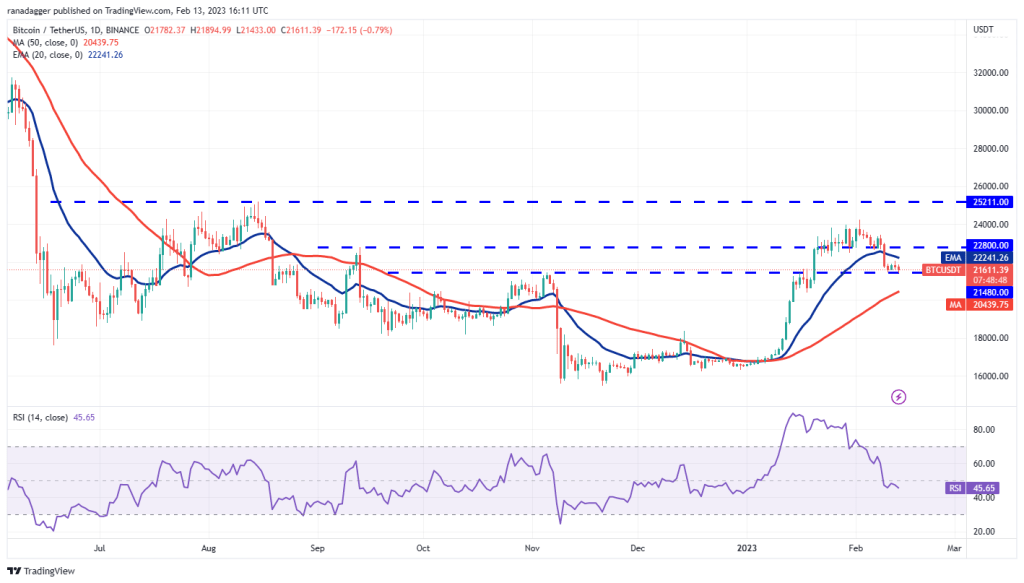
This increases the likelihood of a break below $21,480 for BTC. The downward sloping 20-day EMA and RSI in the negative zone indicate that the path of least resistance is to the downside. The next support is the 50-day simple moving average ($20,439).
If the price bounces back from this support, the bulls will attempt to push the BTC/USDT pair above $21,480 and attack the 20-day EMA. Buyers will have to break through this hurdle to seize control and open the doors for a possible rally to $23,500.
ETH/USDT
Ethereum is struggling to find the $1,500 support. The 20-day EMA ($1,567) is down and the RSI is in negative territory, suggesting that the bears have the upper hand.
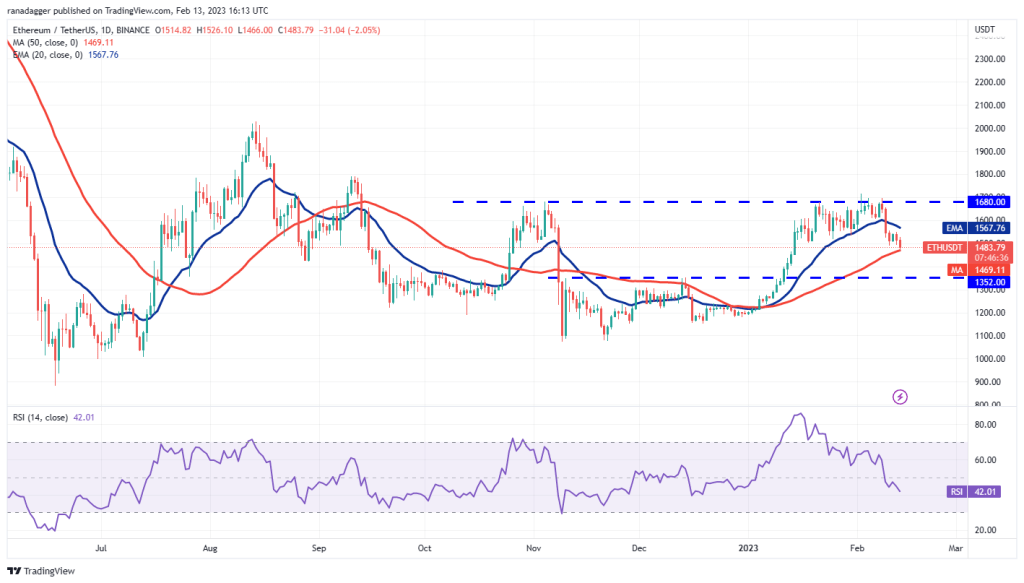
If the 50-day SMA ($1,483) fails to stop the decline, selling could accelerate and ETH/USDT could drop to the solid support at $1,352. This level could attract aggressive buying from the bulls. If the price bounces back, the pair could oscillate between $1,352 and $1,680 for a while.
Another possibility is for the price to bounce off the 50-day SMA and break above the 20-day EMA. The pair could then rally to $1,680, which remains the key level for the bulls to overcome.
BNB/USDT
BNB was rejected on Feb. 12 at $318, suggesting that the bears were selling in the rallies. The bears will try to further strengthen their position by pulling the price below the strong support at $280.
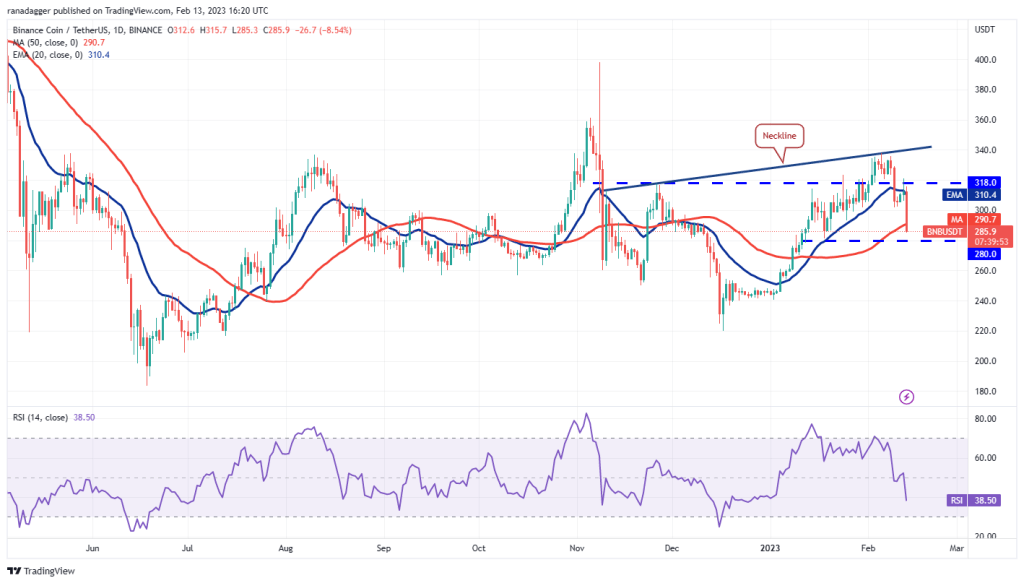
The 20-day EMA ($310) has started to drop and the RSI is in the negative territory, showing that the bears have an advantage. If the $280 level breaks down, the BNB/USDT pair could witness aggressive selling. The next support is at $250.
Conversely, if the price rises above $280, the bulls will attempt to push the pair back above $318. If they are successful, the pair could rise to the neckline of the evolving inverted head and shoulders pattern.
XRP/USDT
The bulls failed to hold the 50-day SMA ($0.38), which indicates a lack of demand at the lower levels. XRP’s next support is at $0.36. The 20-day EMA ($0.39) has started to drop and the RSI has slipped into negative territory, suggesting that the bears have the advantage.
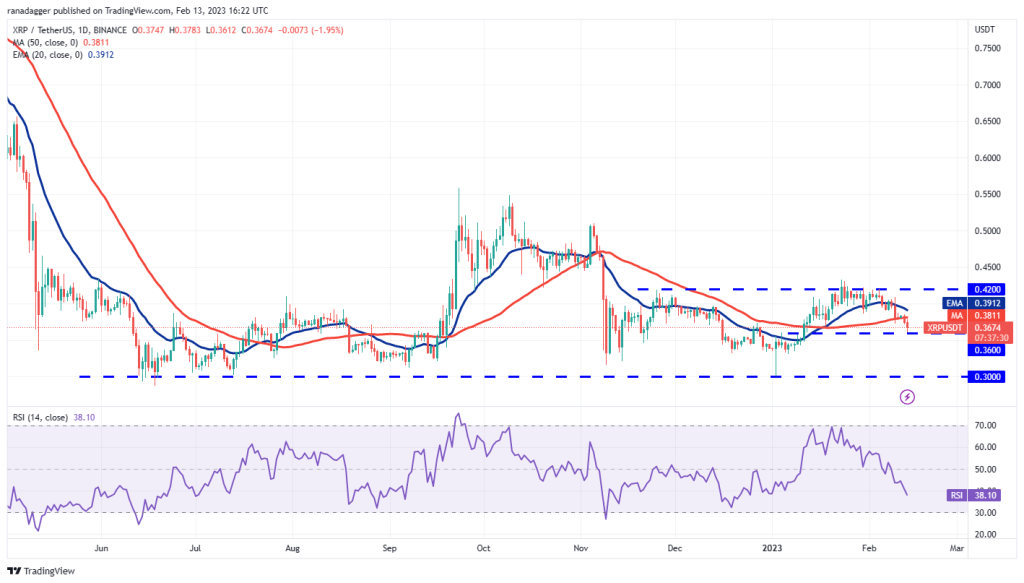
Even if the price recovers from $0.36, the bears will try to sell on the rallies to the 20-day EMA. If the price turns down from this level, it will increase the probability of a break below $0.36. The XRP/USDT pair could drop to $0.33 later. Alternatively, if the price rises and breaks above the 20-day EMA, the pair could be stuck between $0.36 and $0.43 for a while.
DOGE/USDT
Dogecoin (DOGE) is witnessing a fierce battle between bulls and bears near the moving averages. A minor positivity is that the bulls have not allowed the price to stay below the 50-day SMA ($0.08).
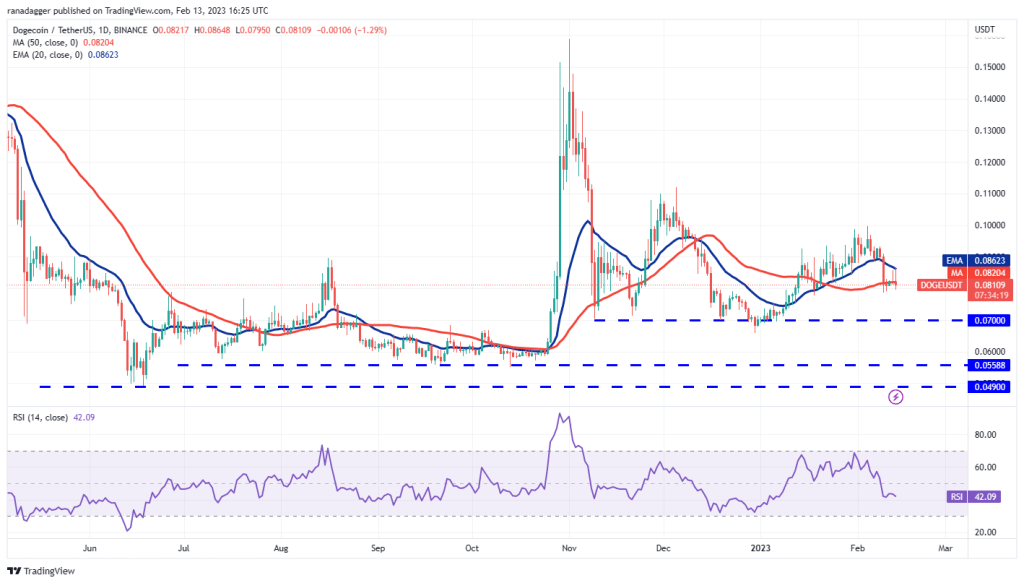
If buyers push the price above the 20-day EMA, the DOGE/USDT pair could rise to the psychological resistance at $0.10. The bears are expected to hold the $0.10 to $0.11 zone strongly because if scaled, the pair could gain momentum and skyrocket to $0.15. Conversely, if the price stays below the 50-day SMA, the bears will attempt to push the pair down to the critical support of $0.07. For DOGE, this level is likely to attract aggressive buying by the bulls.
ADA/USDT
The bulls tried to push Cardano above the 20-day EMA ($0.37) on Feb. 12, but the bears did not budge. This shows that sellers are trying to gain an edge.
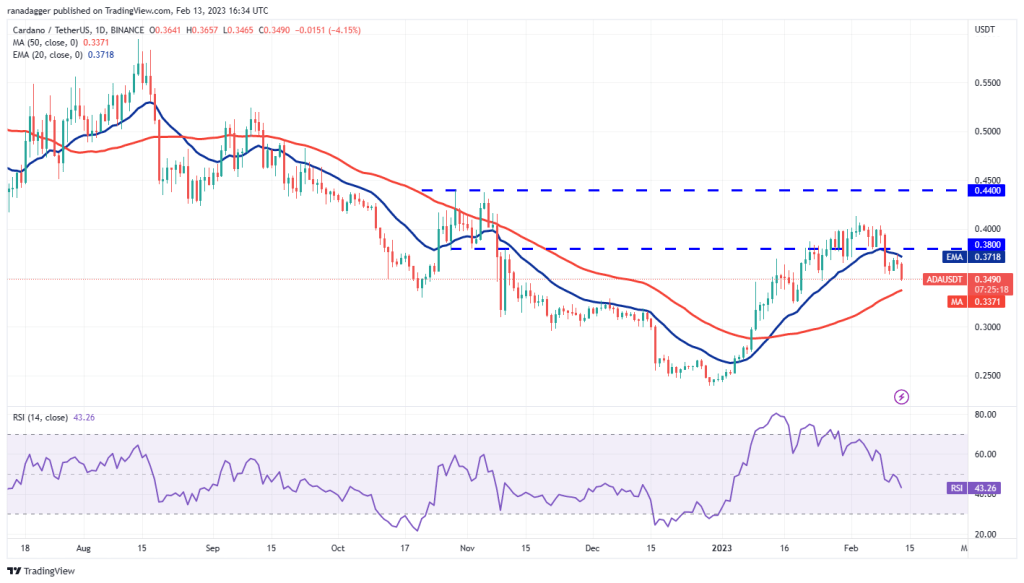
The bears pushed the price below the immediate support at $0.35, paving the way for a potential drop to the 50-day SMA ($0.34) and then to the critical support at $0.32. A break below this level will indicate the bears are back to the top.
If the bulls want to avoid a deep correction, they will have to quickly push the price above the $0.38 resistance. If the price stays above this level, the ADA/USDT pair could climb to $0.41 and then $0.44. This level is likely to be a strong challenge for the bulls.
MATIC/USDT
Buyers attempted to push Polygon above the overhead resistance of $1.30 on Feb. 12, but the bears held their ground. This may have encouraged short-term traders to record profits, which dragged the price below the 20-day EMA ($1.17).
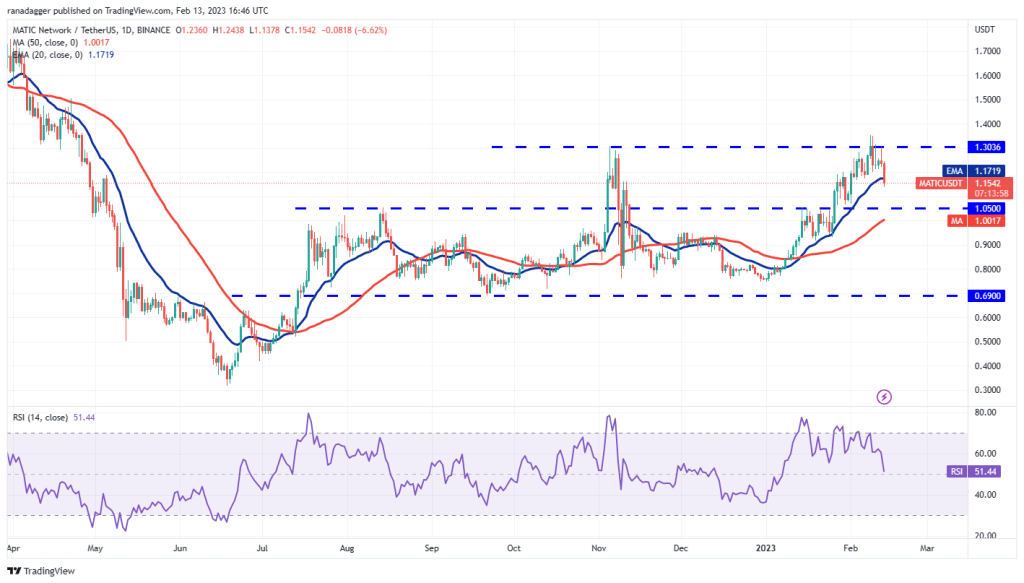
If the bears hold the price below the 20-day EMA, the MATIC/USDT pair could drop to the 50-day SMA ($1.05). The region between $1.05 and $1 is likely to attract buyers.
Usually, after such a deep correction, the next leg of an uptrend may not start right away. MATIC price could fluctuate between $1.30 and $1.05 for a few days before starting the next trend move. Another possibility is for the price to rally from the current level and rally to the overhead resistance of $1.35.
LEFT/USDT
Solana fell below the 20-day EMA ($22.19) on February 9, but the bears failed to push the price below the 50-day SMA ($19.42) on February 10. This suggests that lower levels are attracting buyers.
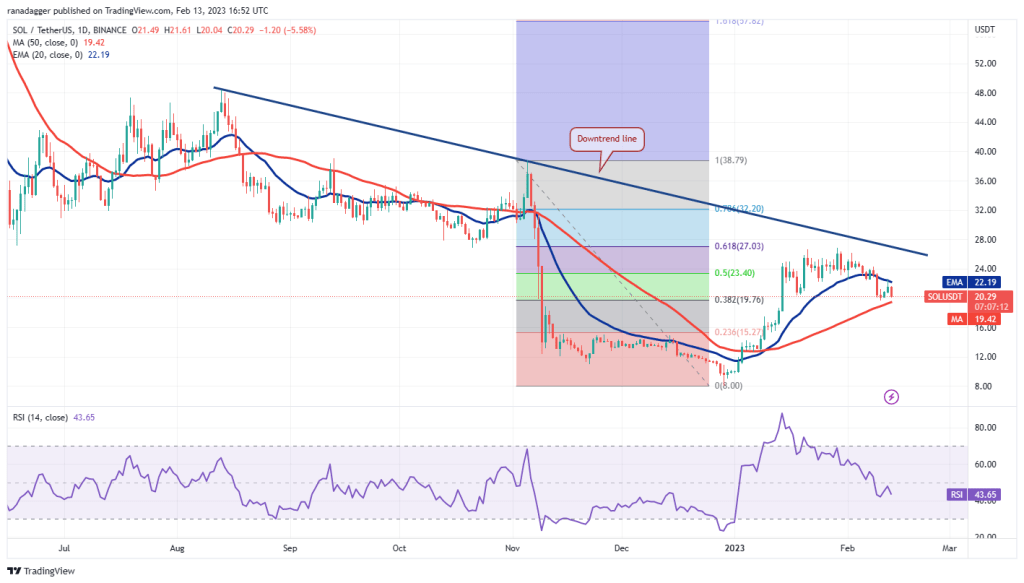
The price has dropped from the 20-day EMA on Feb. 13, indicating that the bears are trying to establish their upper hand. If the price breaks below the 50-day SMA, selling could accelerate and the SOL/USDT pair could drop to $15.
Conversely, if the bulls push the price above the 20-day EMA, the pair could rally to the overhead resistance at $28. This is an important level to consider because a break above it will signal a potential trend change.