Gold prices came under sustained downward pressure this week as the latest macroeconomic data from the US reaffirmed the Federal Reserve’s willingness to keep monetary policy tight. Gold extended its decline towards $1,800 on Friday and closed in negative territory for the fourth consecutive week. ISM’s PMI surveys and action in the US bond markets will be watched closely by market participants as the yellow metal approaches key support levels.
February Consumer Confidence Survey to be reviewed for fresh momentum
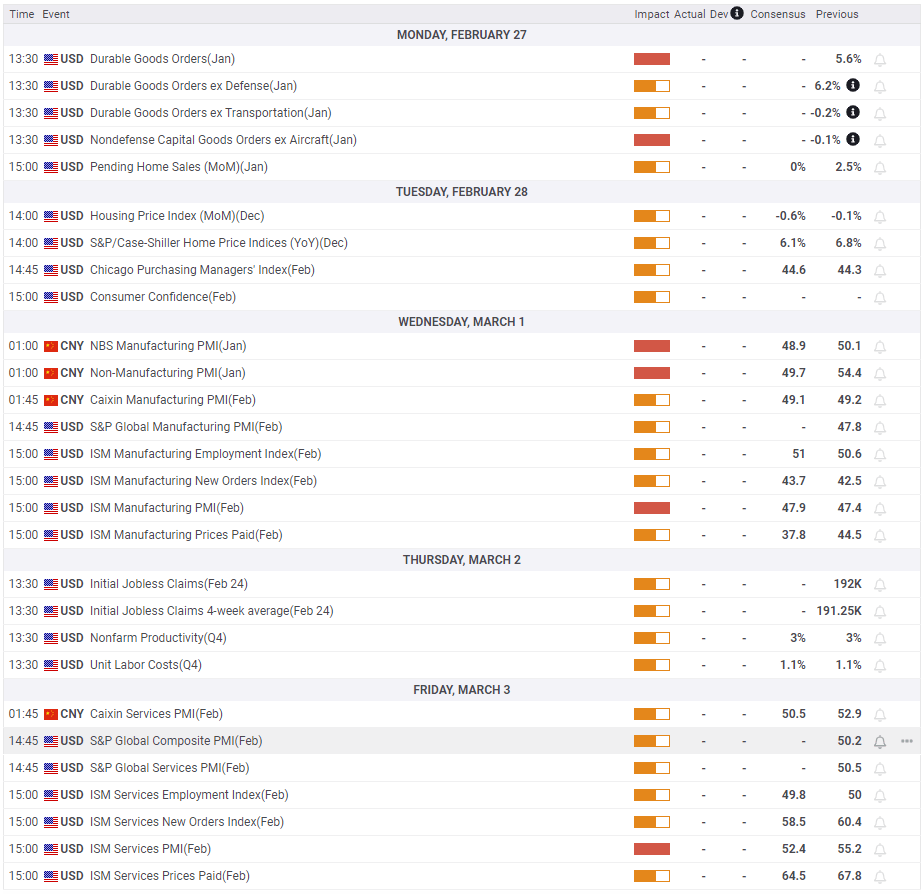
On Monday, the US Census Bureau will release data on Durable Goods Orders for January. Since the beginning of the month, optimistic macroeconomic data from the US supports the USD and a similar market reaction can be expected. However, these data alone are unlikely to significantly affect the Fed’s policy outlook.
On Tuesday, the Conference Board’s February Consumer Confidence Survey will be reviewed for fresh momentum. Expectations of one-year consumer inflation rather than the Consumer Confidence Index headline may trigger the reaction. In January, this component of the survey rose to 6.8% from 6.6% in December. According to market analyst Eren Şengezer, if there is a pullback on this figure, the USD could lose altitude and help gold move into a short-term recovery phase. However, the opposite is also true.

US Treasury bond yields to be watched closely for gold prices
cryptocoin.com As we have reported, ISM will release its Manufacturing PMI and Services PMI on Wednesday and Friday, respectively. Gold is likely to hold ground against its rivals if the ISM’s Services PMI report reaffirms that rising wage costs are feeding accelerating price pressures in the industry. Therefore, the Price Paid Index component will be closely watched by market participants.
It’s worth noting, however, that the CME Group FedWatch Tool has shown that markets have fully priced at least two 25bps Fed rate hikes in March and May. Also, the probability that the Fed will not change the policy rate in June is 25%. “Market positioning suggests that the USD doesn’t have much room to rise, at least until the February jobs report and inflation data confirm or refute another 25bps increase in June,” the analyst said.
Investors will once again be watching US Treasury bond yields next week. According to the analyst, 4% aligns as key resistance for the 10-year US T-bond yield and if this level remains intact, there could be a technical correction. In this scenario, gold prices may turn north due to the inverse correlation with US yields.
Gold prices technical analysis and gold forecast survey
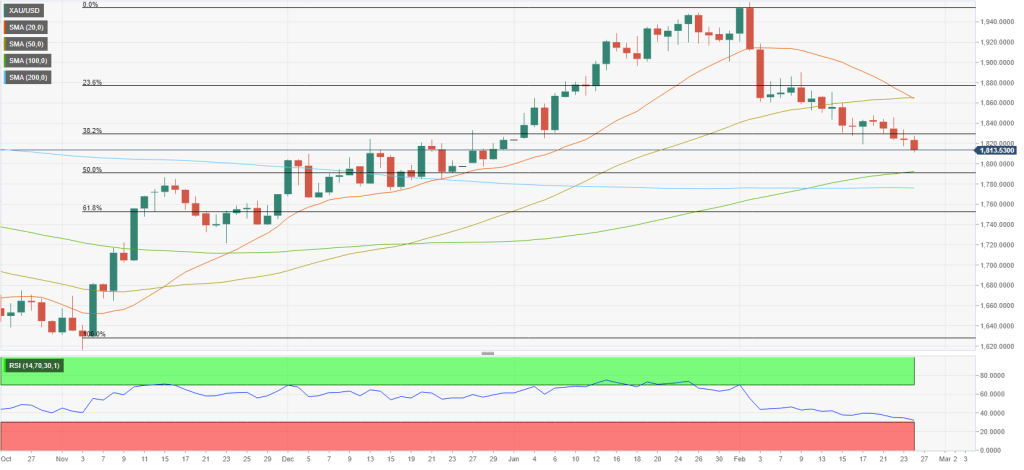
Market analyst Eren Şengezer analyzes the technical outlook of gold as follows. The Relative Strength Index (RSI) indicator on the daily chart is near 30, indicating that gold is about to enter technically oversold. On the downside, $1,800 (psychological level), $1,790 (100-day Simple Moving Average (SMA)) and $1,780 (200-period SMA) are aligned as intermediate support ahead. Should gold continue to drop towards these levels, the daily RSI will likely start to signal oversold conditions. In this scenario, sellers can step aside and wait for a technical fix.
On the upside, $1,830 (38.2% retracement level of Fibonacci recent uptrend, previous support) is aligned as key resistance. With a daily close above this level, additional recovery is gaining towards $1,860 (20-day SMA, 50-day SMA) and $1,880 (Fibonacci 23.6% retracement).
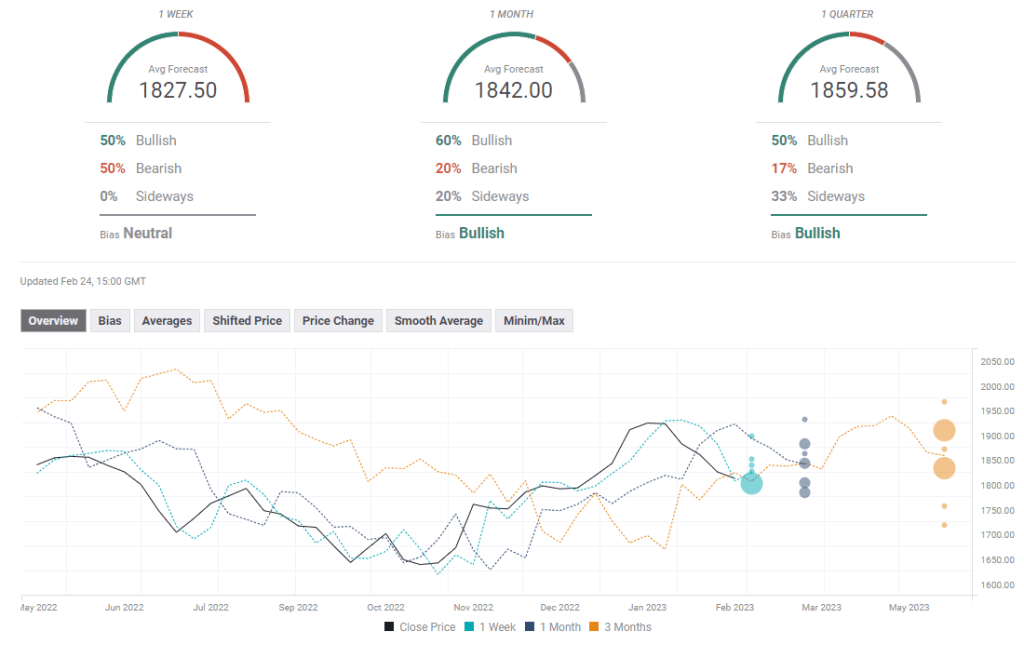
The FXStreet Forecast Survey points to a mixed short-term outlook, with half of the experts adopting a bearish one-week outlook and the other half seeing the gold price rebound next week. The one-month outlook remains bullish with the average target of $1,842.