BTC price is chasing $24,000 again, making these 4 altcoins more likely to target new year-to-date highs.
Bitcoin drops weekly
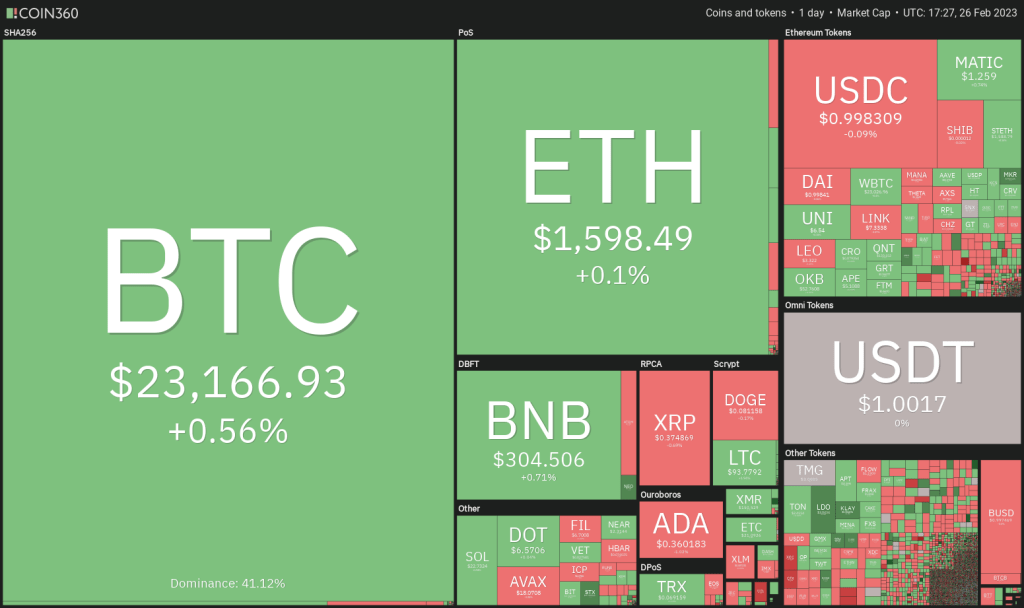
Cryptocurrency and US equity markets have witnessed profit booking this week as macroeconomic data points to continued Federal Reserve rate hikes. Bitcoin fell more than 4% and the S&P 500 fell 2.7% to record its worst week of the year. cryptocoin.comAccording to data, BTC is trading at $23,444, up 1.1% in the last 24 hours.
The CME FedWatch Tool shows the probability of a 25bps rate hike by the Fed at its March meeting as 73%, but after higher-than-expected inflation readings within two weeks, the probability of a 50bps rate hike has started to fade.
BTC and these 4 altcoins analysis
BTC/USDT
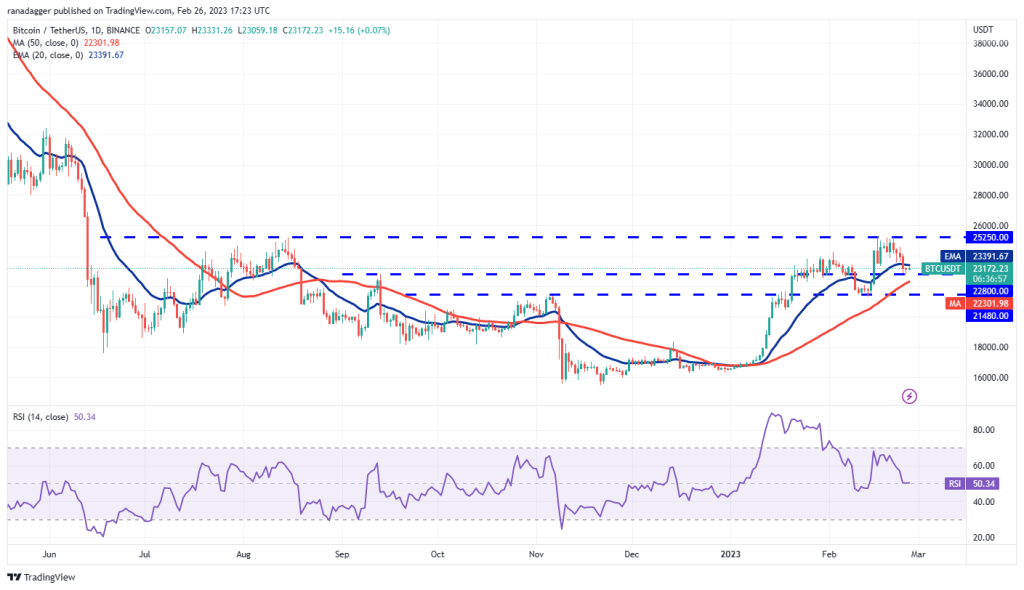
Bitcoin fell below the 20-day exponential moving average ($23,391) on February 24, but the bears were unable to develop this advantage and keep the price below the strong support of $22,800. The price bounced off $22,800 on February 25 and the bulls are trying to push the price above the 20-day EMA. If they manage to do so, this will indicate that the BTC/USDT pair could consolidate between $25,250 and $22,800 for a few days.
The flattening 20-day EMA and the RSI near the midpoint also suggest a range-bound move in the near-term. Alternatively, if the price dips below $22,700, selling could intensify and the pair could decline to the next strong support at $21,480.
The 20-EMA is back on the four-hour chart and the RSI is in the negative territory. This points to an advantage for the bears. Sellers will try to protect the 20-EMA and if the price drops from this level, the probability of a break below $22,800 increases. If this happens, the sell-off could intensify and the pair could drop to $21,480.
On the contrary, if the price rises above the 20-EMA, it will indicate that the bulls are buying on the dips. This could push the pair to the 50-simple moving average and keep the price inside the range for a while.
LDO/USDT
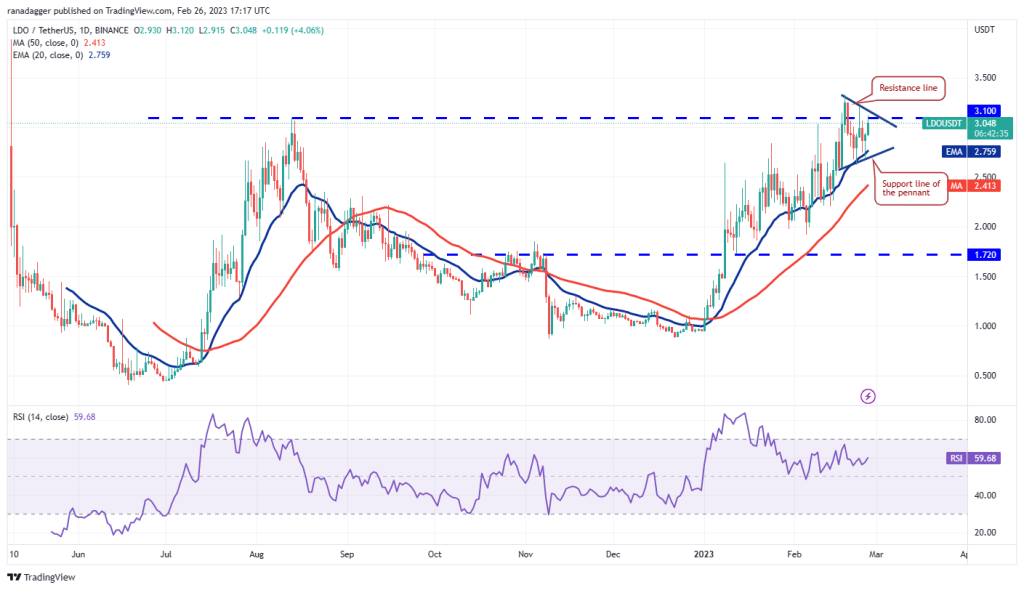
Lido DAO (LDO) failed to stay below the 20-day EMA ($2.75) during the last correction, which is a positive sign. Another bullish sign is when the pennant is forming near local highs. The bulls will try to push the price above the resistance line of the pennant. If successful, this altcoin pair could initiate the next leg of the upward move. The pair could rise to $3.90 first and then attempt to rise to $4.24.
Conversely, if the price turns down from the resistance line, it will show that the bears are selling in the rallies. This could keep the price inside the pennant for a while. The bears will have to push the price below the pennant if they want to signal a short-term trend reversal.
A strong rebound of the pennant from the support line indicates aggressive buying on the dips. Buyers will have to break through the hurdle at the resistance line to regain control. If they do, the pair could resume its uptrend.
But the bears are likely to have other plans as they will try to protect the resistance line. If the price returns below this level, the equilibrium situation may continue for a while. A break below the pennant could attract profit booking by short-term traders. This could drive the price down to $2.20 and then $2.
EGLD/USDT
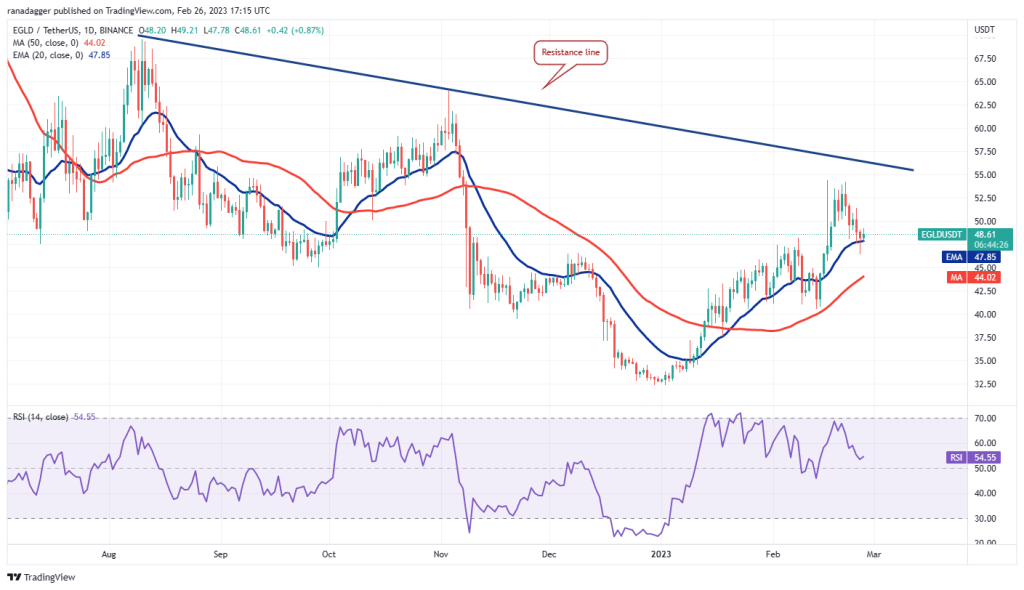
MultiversX has been rebuffed from the resistance line but an encouraging sign is the bulls attempting to defend the 20-day EMA ($47). Both moving averages are rising and the RSI is above 54, suggesting that buyers have a slight advantage. The bulls will try to push the price towards the resistance line, where they will likely face strong opposition from the bears.
This bullish view could be invalidated in the near term if the price drops and breaks below the 20-day EMA. This will show the bears selling on each minor rally. The EGLD/USDT pair could then drop to the 50-day SMA ($44) and later to $40.
The four-hour chart shows the price falling within a descending channel pattern. Buyers bought lower and pushed the price to the resistance line of the channel. If this resistance collapses, the pair could rise to the 50-SMA and then attempt to retest the strong barrier at $54.
On the contrary, if the price turns down from the resistance line, it will show that the bears are not giving up. This could result in a drop towards the support line of the channel.
THETA/USDT
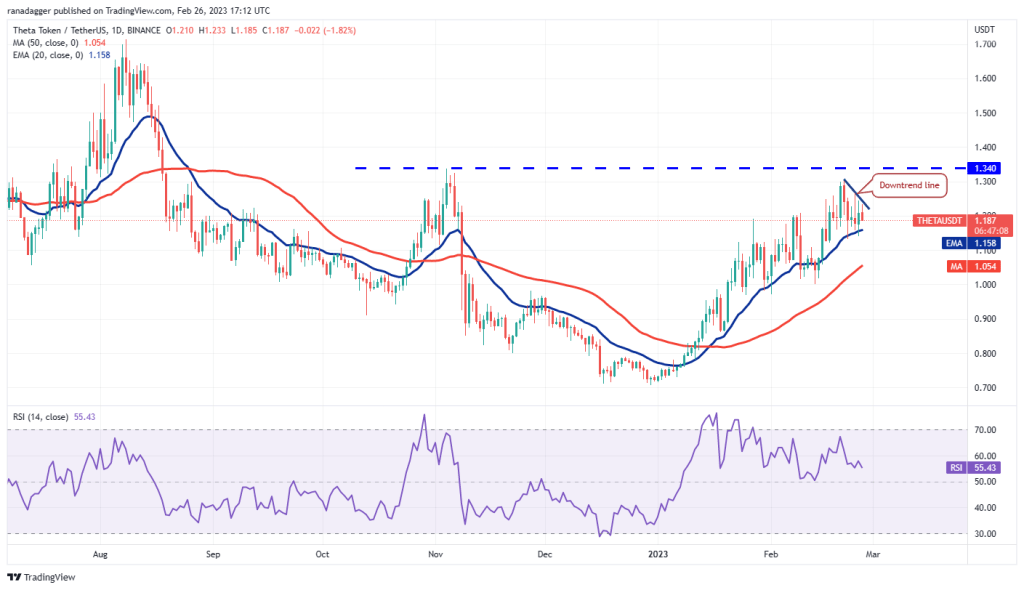
The bulls are trying to stop Theta Network’s retracement at the 20-day EMA ($1.15). Both moving averages are rising and the RSI is in the positive zone, pointing to the advantage of the bulls. If buyers push the price above the downtrend line, THETA/USDT could climb to the overhead resistance at $1.34. This is a tough resistance and a break above it could open the doors for a possible rise to $1.70.
Instead, if the price drops below the 20-day EMA, it will indicate that the short-term bulls are rushing to the exit. This altcoin could initiate a deeper correction at the 50-day SMA ($1.05) followed by the psychological support at $1.
The four-hour chart shows the formation of a symmetrical triangle formation. Both moving averages have flattened out and the RSI oscillates near the centre, indicating a balance between supply and demand.
A break below the triangle could turn the short-term advantage in favor of the bears. The pair may drop to $1.12 and then to $1. If the bulls want to avoid the decline, they will have to quickly push the price above the triangle. This could start a trip for $1.27 and then $1.30.
KLAY/USDT
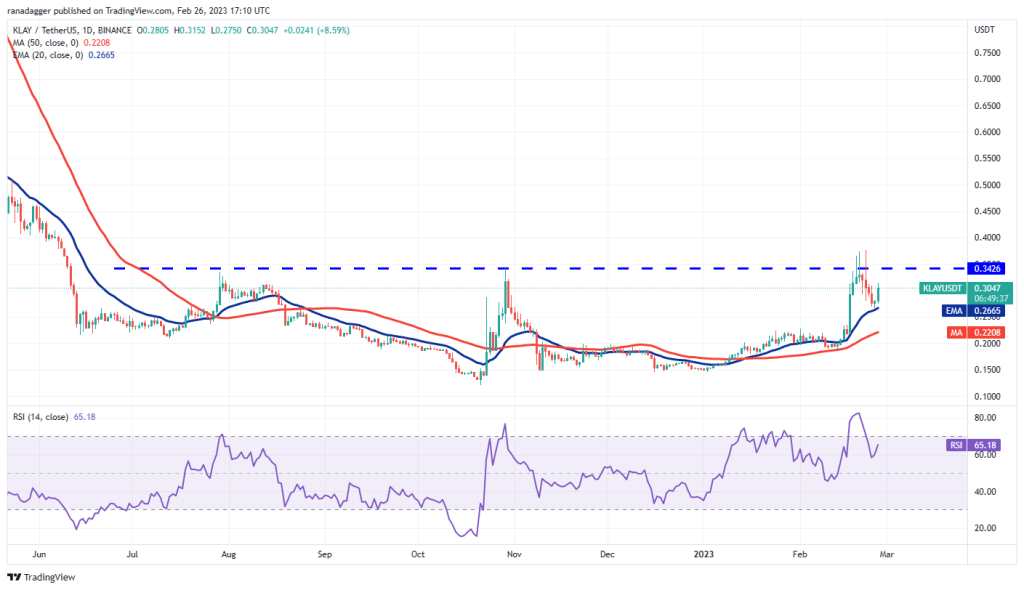
Klaytn (KLAY) is trying to break out of its base model. The price rebounded from the 20-day EMA ($0.26) on Feb. 25, pointing to solid buying on the dips. The bulls will try to pierce the overhead resistance at $0.34. If they do, this altcoin pair could gain momentum and rise to the psychological resistance at $0.50. Such a move would indicate a potential trend change.
If the price drops from $0.34, it will show that the bears are fiercely holding the level. This could push the price back to the 20-day EMA. A break below this level may indicate that the pair may spend some more time in the base formation.
The bulls stopped the pullback near the 61.8% Fibonacci retracement of $0.26 and started a recovery. There is a minor resistance at $0.32, but if this level is surpassed, the pair may attempt a rally to $0.34 and then $0.37.
On the other hand, if the price drops from the overhead resistance, it will show that the bears are selling on the rallies. This could increase the possibility of a break below $0.26. If this happens, the pair could slide towards $0.22.