
According to crypto analyst Akash Girimath, Bitcoin price has approached the lower end of the bull structure after the market sell-off on Thursday. This move also caused many altcoin traders to be caught off-guard, leading to a $65 million liquidation. Regardless, the analyst says investors should be careful as they struggle to find BTC fundamentals and evaluate indicators for Bitcoin prediction.
Bitcoin prediction: BTC price plays the silent game
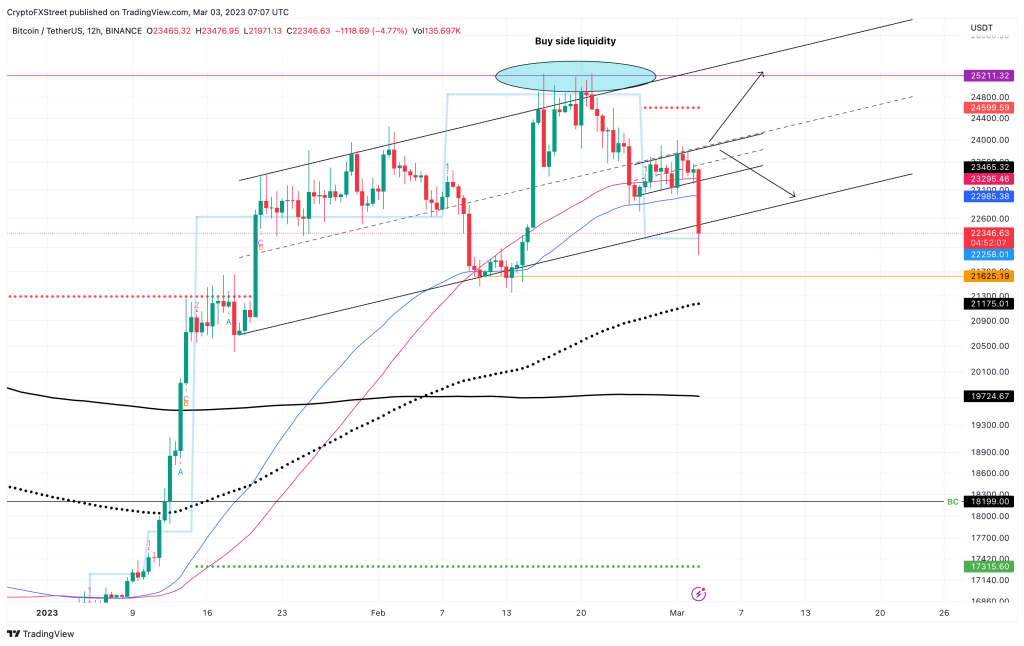
Bitcoin price has identified five highs and two higher lows in its quest to tag and surpass the psychological $25,000 level. Combining trendlines at these swing points reveals an ascending parallel channel. Thursday’s drop caused Bitcoin price to surpass the 200 four-hour Simple and Exponential Moving Average (SMA, EMA) and is currently rebounding from the breakout line of the Momentum Reversal Indicator (MRI) at $22,258.
This breakout line is key in determining the next move for Bitcoin price. From a technical perspective, a breakdown of the $21,265 support level will create a lower low. Such a development would not only trigger selling pressure from the sidelined investors, but would also invalidate the bullish outlook. The combined selling pressure will most likely break the 200-day EMA at $21,175 and tag the 200-day SMA at $19,724.
 BTC 1-day chart
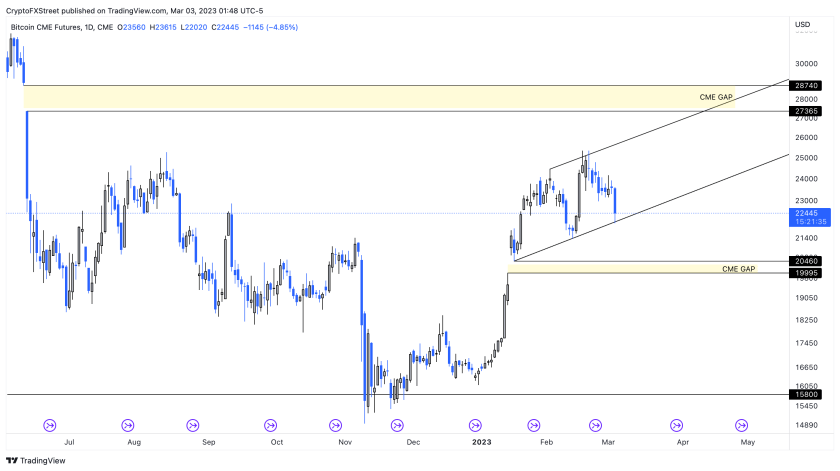
An interesting detail about the aforementioned levels is that they overlap with the gaps in Bitcoin price action seen on the Chicago Mercantile Exchange (CME). CME only allows BTC trading on weekdays, so the chart has gaps on weekends. Graphics experts have found that gaps are almost always filled eventually. This indicates that the chances of BTC price falling to the level of the CME gap and filling it are increasing.
If bitcoin price breaks the continuing bullish structure and turns the $21,625 support level into a resistance barrier, the next important zone will be the sudden CME gap from $19,995 to $20,460 coinciding with the 200-day SMA.
 BTC 1-day CME chart
Is there a break in Bitcoin’s correlation with the stock market?
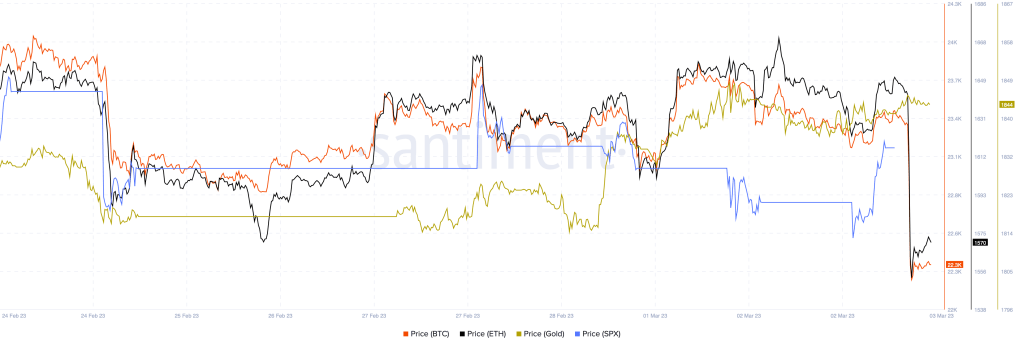
cryptocoin.com As you follow, BTC and the stock market are both affected by the cost of money and the value of the US dollar, which is linked to policies enacted by the Federal Reserve. So, the Bitcoin price is to some extent correlated with the stock market. Therefore, when there is a break between stock prices and BTC, as in the last sale of BTC, it is the exception to the rule.
The chart below for the Bitcoin forecast shows that the recent decline of BTC is an isolated incident. BTC and ETH fell sharply while the S&P 500 saw an increase. Meanwhile, the gold price was not affected. It is too early to determine whether this disconnect will continue in the short-term or longer-term.
 BTC – ETH – Gold – S&P500 chart
Traders should probably adopt a ‘look before you jump’ philosophy regarding the current drop in BTC price rather than jumping on the bandwagon. After such a sudden move, the market needs time to consolidate before revealing the next hand. Until then, investors should remain cautious. If the $21,625 support level or bullish structure continues and the sidelined buyers come to the rescue of Bitcoin, investors can expect BTC price to attempt a recovery. In such a case, $23,747 would be a difficult level to exceed.
Doing this successfully will pave the way for collecting buyer-side liquidity remaining above the even highs of $25,211. A change at this level on a weekly timeframe would invalidate the bearish view and potentially trigger a rally to the $30,000 psychological level.