
Bitcoin (BTC) price continues to face selling pressure, but the start of a short rally or consolidation could lead to sharp gains in some altcoin projects.
Bitcoin and altcoin projects under pressure
The Dow Jones Industrial Average fell for eight consecutive weeks, the first such streak since 1923. On May 20, the S&P 500 briefly fell into bear market territory, suggesting investors continue to sell risky assets for fear of a recession. Bitcoin (BTC) has been under pressure for weeks due to its tight correlation with US stock markets. The bulls are trying to push Bitcoin higher over the weekend and prevent an even longer streak of losses.

Bitcoin’s performance in the first five months was the worst 5 months since 2018, showing that the market is under the control of the sellers. However, after a few weeks of weakness, the crypto markets could be on the cusp of a bear market rally. What are the critical levels that can signal the beginning of a sustainable recovery? As Kriptokoin.com, we present the analysis and analyst opinions for Bitcoin and 4 altcoin projects that may perform better in the near term.
Beware of critical levels for Bitcoin and 4 altcons:
Bitcoin(BTC)
Bitcoin recovered the important support from $28,630 on May 20 and is close to this level. It showed that it was a purchase. The bulls are attempting to push the price above the downtrend line, which could be the first indication that selling pressure could drop. Above the downtrend line, the BTC/USDT pair could rise to the 20-day exponential moving average ($31,887). Bears are likely to fiercely defend this level. If the price breaks from the 20-day EMA, the bears will once again attempt to push the pair below $28,630. The 4-hour chart
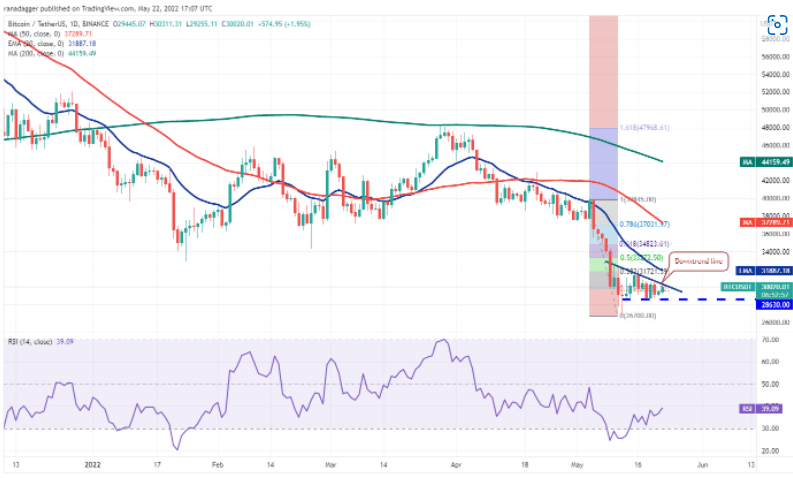
shows that the price is stuck between the downtrend line and $28,630. The 20-EMA and 50-SMA have flattened out, with the relative strength index (RSI) just above the midpoint, showing an equilibrium between supply and demand. If this balance keeps the price above the downtrend line and sustains it, buyers can turn in favor. If this happens, the pair could start a northward walk towards the 200-SMA. Conversely, if the price declines from the current level, the bears will attempt to push the pair below $28,630 and gain the upper hand.
Binance Coin (BNB)
Binance Coin (BNB) rebounded sharply from critical support at $211 and is at the 20-day EMA ( $323) reached general resistance. This is an important level for the bears to defend because a break and close above it could indicate that a bottom may be in place. Above the 20-day EMA, the BNB/USDT pair could rally to $350 and then to the 50-day SMA ($376). This level could act as a hard hurdle again, but if the bulls push the price above it, the pair could rally to the 200-day SMA ($451). Contrary to this assumption, if the price drops sharply from the 20-day EMA, it will indicate that the bears have not given up yet and continue to sell higher. The pair could decline to $211 later. If the price bounces back from this level, the pair could consolidate between $211 and $320 for a few days.
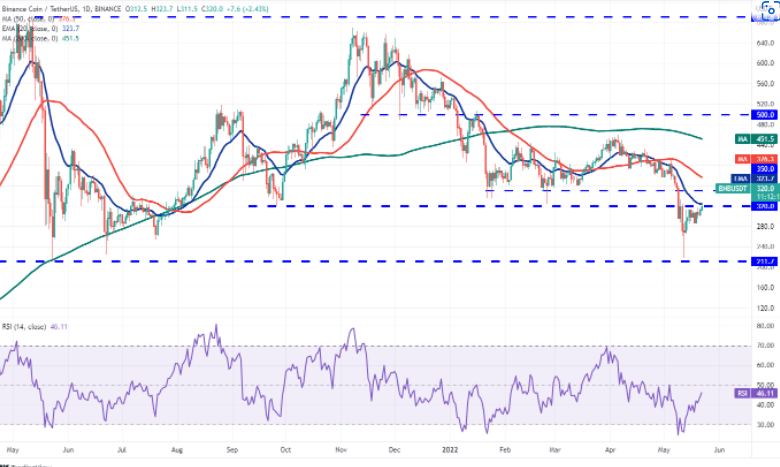
The bulls are attempting to push the price above the overhead resistance at $320. If they are successful, the pair could rally towards $350. Bears are likely to defend this level aggressively. If the price declines from $350, the pair could drop back to $320. If the price bounces back from this level, the pair could stay range-bound between $320 and $350 for a while. The bullish momentum could rise above the 200-SMA and the pair could rally to $380 and later to $400. Conversely, if the price declines from the current level, the pair could drop to $286 and then $272.
Monero (XMR)
Monero (XMR) dropped below the strong support at $134 on May 12 but the bears failed to sustain lower. This suggests buying aggressively on dips. The price recovered sharply to the 20-day EMA ($179). If the bulls push and sustain the price above the 20-day EMA, the XMR/USDT pair could rise to the overhead resistance zone between the 200-day SMA ($202) and the 50-day SMA ($212). Bears are expected to put up a strong defense in this zone. If the price drops from this zone but the bulls stop the next drop at the 20-day EMA, it will suggest a potential change in trend. Conversely, if the price declines from the current level, the bears will try to push the pair to $150 and then $134.
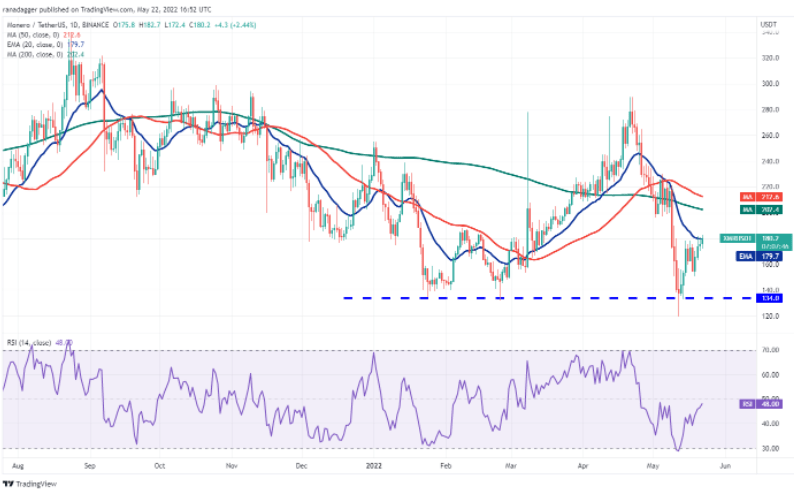
The 4-hour chart shows the formation of higher lows and higher highs. The bears tried to push the price below the 50-SMA but the bulls successfully defended the level. This marks a shift in sentiment from selling on rallies to buying on dips. The pair may rally to the 200-SMA later, where the bears may offer strong resistance. If the bulls break this hurdle, the pair could rally to $225. Contrary to this assumption, if the altcoin price declines and falls below the 50-SMA, the pair could drop to $150. A break below this level might challenge the strong support at $134.
Ethereum Classic (ETC)
Ethereum Classic (ETC) fell sharply from $52 on March 29 to $16 on May 12. The bulls are attempting to start a recovery that may face resistance at the 20-day EMA ($23). If the price breaks from the 20-day EMA, the bears will attempt to resume the downtrend by pulling the ETC/USDT pair below the critical support at $16. On the contrary, if buyers push the price above the 20-day EMA, it will suggest the start of a stronger relief rally. The positive divergence in the RSI also points to the possibility of a recovery in the near term. The pair could then rally to the 38.2% Fibonacci retracement level from the $30 high where the bears could form a strong resistance.
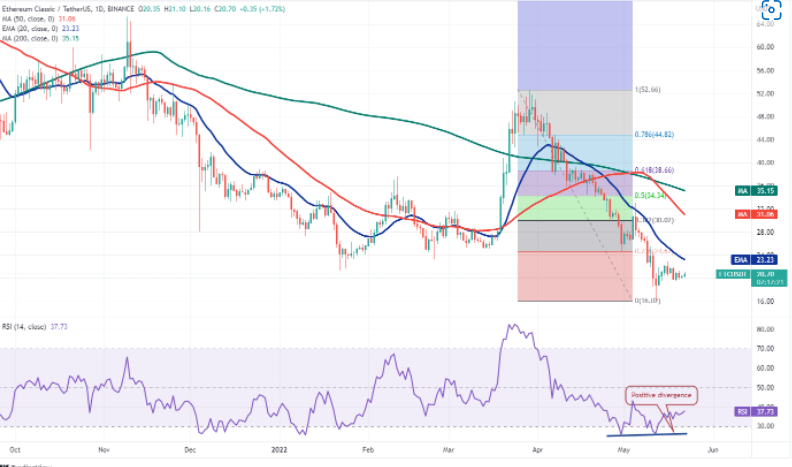
The price has been trading between $19 and $23 for a while. This suggests that the bulls are attempting to create a higher low, but the bears continue to pose a strong challenge at the higher highs. The flattening 20-EMA and 50-SMA do not give the bulls or the bears a clear advantage. If buyers push the price above $23, it will suggest the start of a new upward move. The pair could rally to the 200-SMA and then to $33. Alternatively, the bears will gain the upper hand if the price drops below $19. They will then try to bring the pair down to $16.
Last altcoin on the list: Decentraland (MANA)
Decentraland (MANA) bounced back from the 20-day EMA ($1.24) on May 16, but the bulls’ price Not letting the psychological level stay below $1 is a positive sign. Buyers will once again try to push the price above the 20-day EMA. If successful, the MANA/USDT pair could rally towards the 50-day SMA ($1.72). The bears may face stiff resistance at this level again, but if the bulls break through this hurdle, the pair could begin a further northward walk towards the 200-day SMA ($2.72). Contrary to this assumption, if the price drops below $1, the bears will attempt to push the pair down to the critical support at $0.60. A break and close below this level could start the next leg of the downtrend.
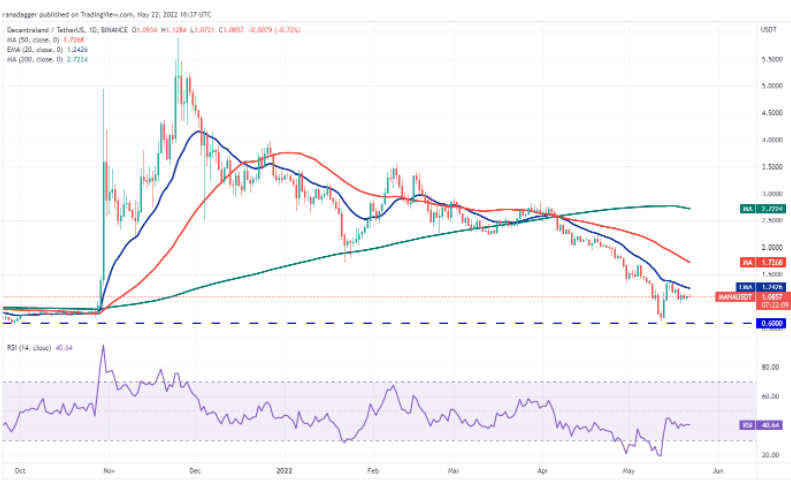
Altcoin price is stuck between $0.97 and $1.36, suggesting bulls take lows below $1 and bears sell on rallies. The 20-EMA and 50-SMA have flattened out, showing that the consolidation may continue for a while. If the buyers push the price above the 50-SMA, the pair could rally to the resistance of the range at $1.36. The bullish momentum could increase if the buyers break this hurdle. Conversely, the bears could gain the upper hand if the price declines and breaks below the support at $0.97.