The Bowl Pattern and the Inverted Cup Pattern are among the trend reversal patterns that indicate that the rising and falling trend is coming to an end. In these types of formations, if the prices exceed the support or resistance level, it is seen that the movement will move in the opposite direction of the current trend.
What is the Bowl Formation?
The “dish” formed on the chart is among the formations that are usually seen at the bottom of the markets and point to the starting uptrend. The Çanak Pattern is also seen as a continuation pattern in uptrends that do not start with sufficient strength or lose their power for a while after a downtrend that ends. For investors, the Çanak Formation is similar to the letter U, which creates very significant profit margins in the short, medium and long term. While this formation is forming, the trading volume moves parallel to the chart, while it is at its lowest level at the bottom of the bowl, an increase is observed in the trading volume with the breaking of the resistance. The expected rise after the resistance is broken is as much as the depth of the bowl.
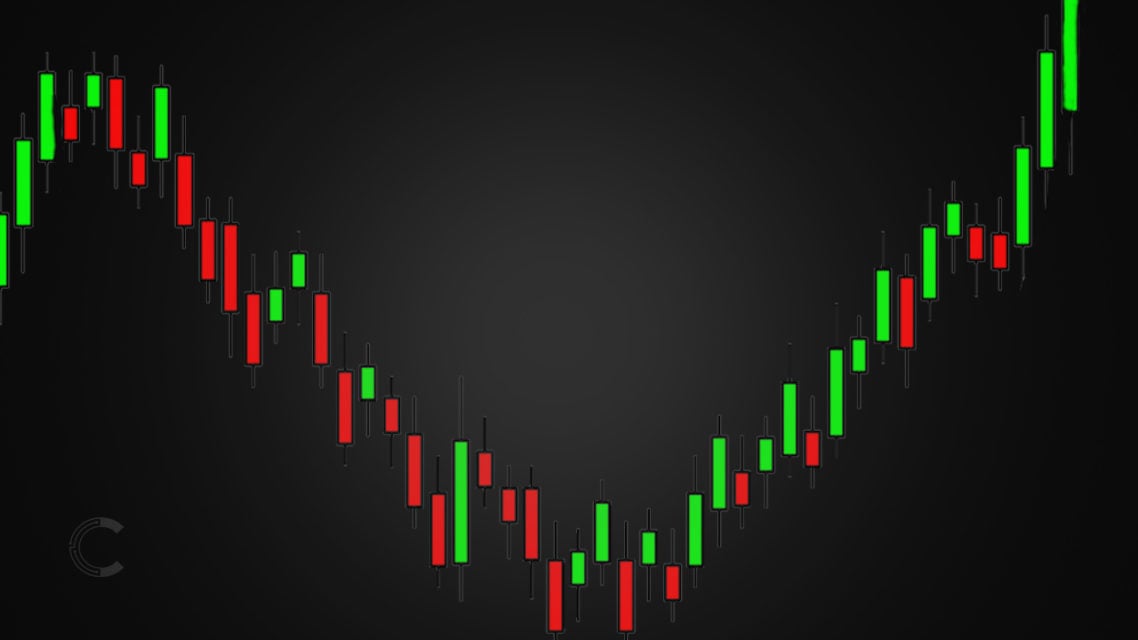
The Çanak Formation resembles a cup shape. With the sales coming after the rising trend is completed, a bottom point is formed in the market first. With the decrease in sales at the bottom level, the horizontal movement continues for a while. In this period, although the downward trend has ended, a horizontal course is observed in the market as there has not been an upward trend yet. At the middle level of the bowl, the trading volume drops to its lowest level.
Then, when the resistance is broken, the trading volume increases and the chart moves upwards. This ascent is the final step that creates the bowl shape. A rise is expected as much as the depth formed.
What is Inverted Bowl Formation?
The Inverted Bowl Pattern is the opposite of the Bowl Pattern. Although it is not as common as the other, it gives an important sell signal to the investor when seen. For the formation of this formation, a downtrend must be seen first. With subsequent sales, a peak occurs first in the market. Then, with the decrease in buying at the peak level, the search for the peak continues with a horizontal movement for a while. As prices increase, trading volume decreases, which indicates that the trend is weakening.
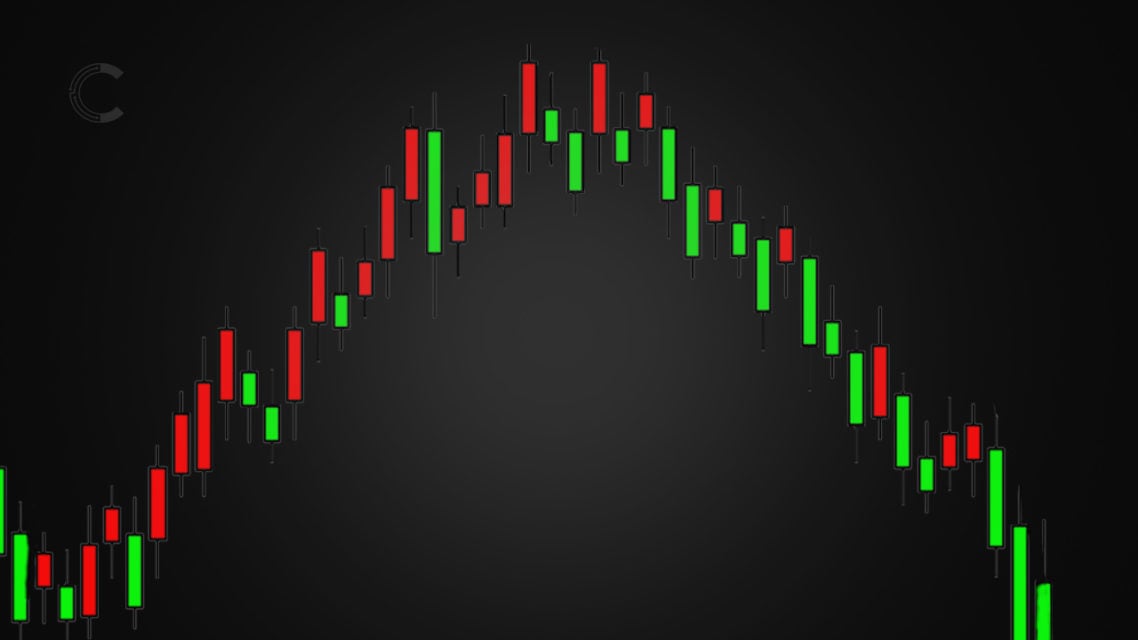
In the last stage, the downtrend leaves its place to an uptrend. Sales first start to increase with a low momentum. With the increase in sales, a slight decrease in prices is observed. After the dish is completed, the transaction volume starts to increase with the sales. When the support level is broken with a high volume, the formation is completed and sales accelerate. The Inverted Bowl Formation is similar to the lowercase “n”.
Note:The Bowl Pattern is usually seen in markets where the price of an asset is cheap, while the Inverted Cup Pattern is seen in the markets where the price of the asset is high.