Bitcoin moves horizontally at $ 104,000, while investor psychology also shows significant changes. Social emotion indicators point to decreasing debates on the greed and fear levels in the market. This gives clues that investors have switched to the waiting position and the market approaches a possible breaking point.
Bitcoin and social emotion change of $ 104,000
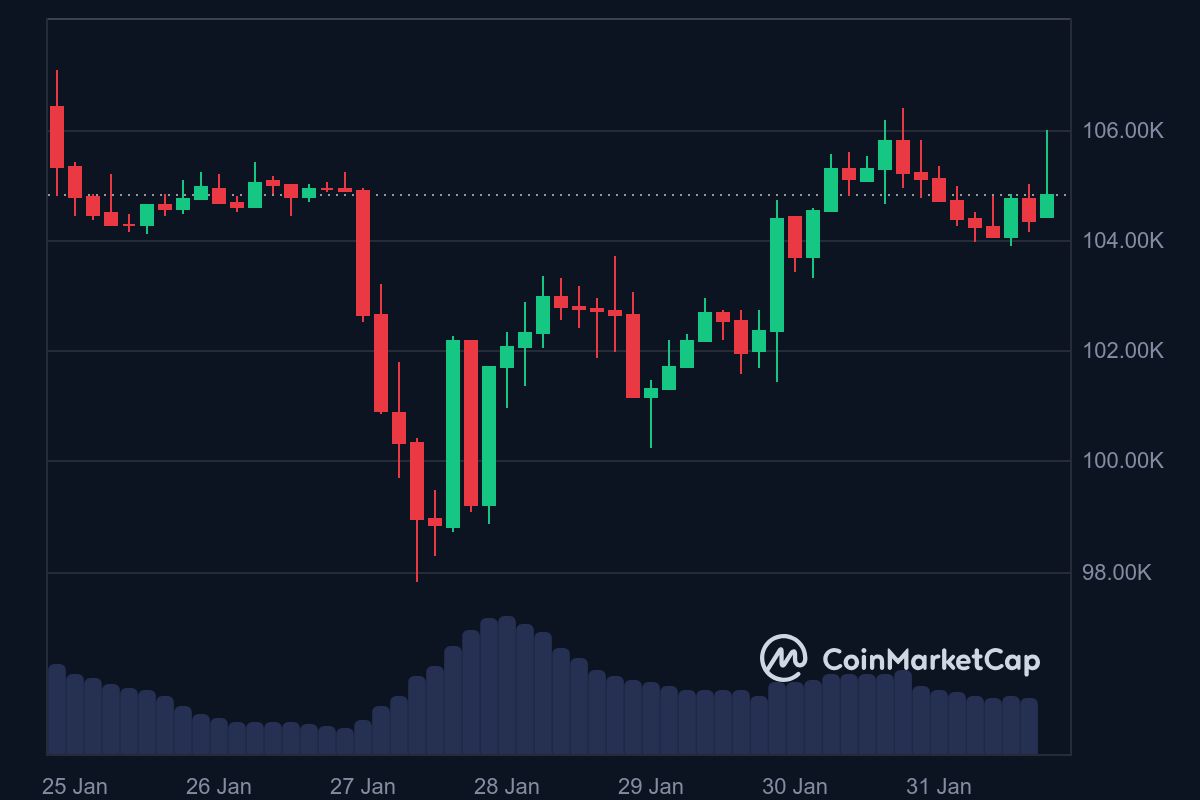
Bitcoin is trading at $ 104.250 and has a decrease of 0.47 %in the last 24 hours. However, indicators of social emotion show a significant change in investor behaviors despite price stability.
According to the latest market data, the decrease in both greed and fear of fear among investors stands out as a remarkable development. Especially in the price ranges of $ 90,000-95,000 and 110,000-115,000 dollars, there was a decrease in social volume.
This suggests that investors have entered the waiting process in the market and that Bitcoin has passed to an accumulation phase. Historically, such periods often come before major price movements.
Technical indicators show that Bitcoin is strong
Bitcoin continues to remain above important moving average levels. The 50 -day moving average is at $ 99,326, and the 200 -day moving average is 77.536 dollars. Staying above these levels shows that the general structure of Bitcoin is suitable for the bull market. However, changes in market sensitivity can create unexpected fluctuations in price movements.
An example in mid -January showed that the price of Bitcoin has an instant decline with the increase in their level of social greed. Similar situations were recorded on 4 December and 16 December 2024. This shows that the market tends to react to emotion data in the opposite direction and that investors should be careful against such fluctuations.
MVRV ratio and market risk
Bitcoin’s 30 -day market value/actual value (MVRV) ratio reached a critical level. This metric usually shows a decrease tendency before reaching the peaks of the price.
Currently, the MVRV ratio decreases from the summit levels and gives a decrease signal. Historically, this shows that the price may become fragile in the short term.
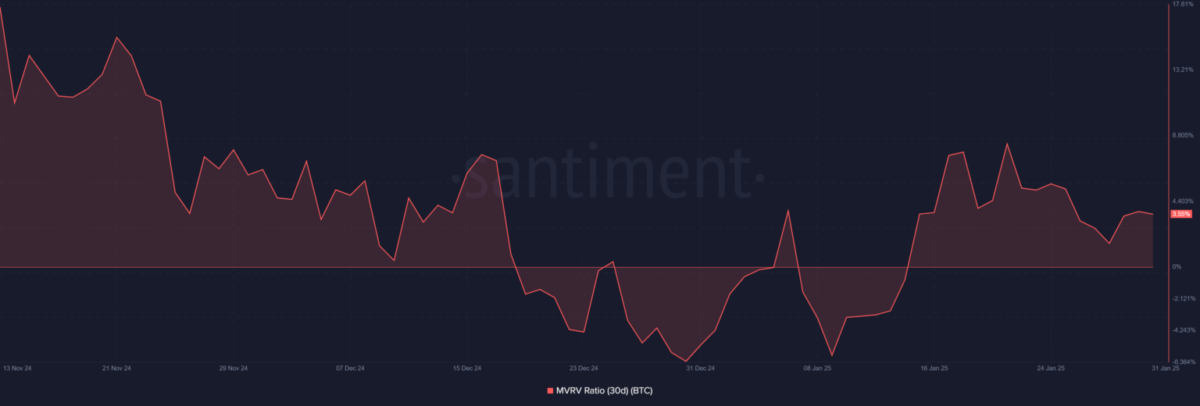
For long -term investors, the current state of MVRV shows that it is a cautious optimism in the market. In other words, investors take into account short -term risks, while maintaining long -term expectations.
Process Volume and Technical Structure
Bitcoin’s trading volume is currently at the level of 1,740 BTC and indicates that the market shows a moderate activity.
The relative power index (RSI) is not at the level of 57,52, that is, Bitcoin is not in excessive purchase or over -selling zone. This shows that the price is in a balanced momentum for now.
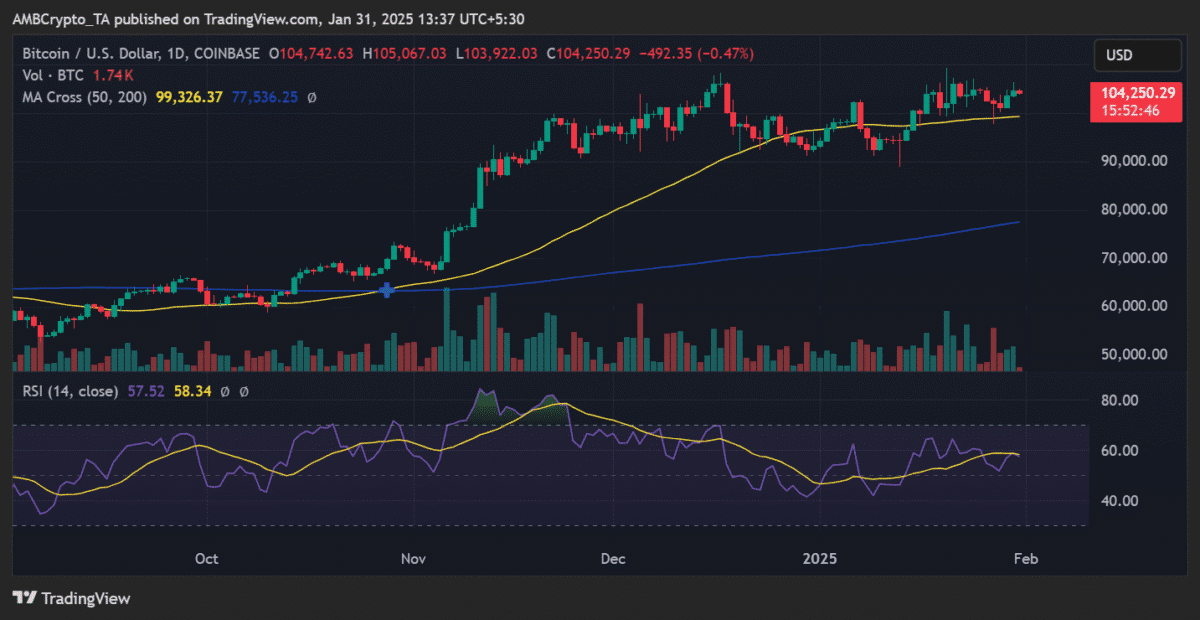
Bitcoin’s current structure continues to remain strong in terms of technical analysis. The price, especially above the 50 -day moving average, indicates that the upward movements can continue.
However, the decrease in social emotion indicators suggest that the price can move in a narrow band for a certain period of time and that the market can look for balance before a major change of direction.
Social cycles and price movements in the Bitcoin market
When Bitcoin’s social emotion data are analyzed, there are five different cycles since November 2024. In these cycles, it was observed that the price usually moves in the opposite direction when the market reached excessive greed or excessive fear levels.
Currently, the price of Bitcoin is around 104,000 dollars stable, while the level of social interaction decreases is experiencing a process. This usually points to the accumulation stages when we look at the previous market cycles.